
How much smart heating saves under October 2026's cap
Heating is the largest cost on the October 2026 capped UK bill, yet savings claims range from roughly 8% to 23%. This recipe separates independently verified figures from manufacturer studies — converted at the confirmed 7.97p/kWh gas rate — so mid-skill readers know which smart thermostat and smart radiator valve setups genuinely pay.
October 2026 price-cap control panel
For households trying to lower energy bills after Ofgem’s October 2026 price-cap increase, heating is the sensible place to start. The cap does not limit an individual bill: these headline figures describe a typical Direct Debit household using Ofgem’s stated consumption profile.
| October 2026 measure | Confirmed figure | What it means |
|---|---|---|
| Headline cap | £1,723 a year [1] | An annualized illustration for a typical dual-fuel Direct Debit household, not a maximum bill. |
| Gas | 7.97p/kWh plus 29.68p/day standing charge [1] | Use 7.97p/kWh when converting a measured reduction in gas consumption into money. |
| Electricity | 26.32p/kWh plus 54.83p/day standing charge [1] | Relevant to thermostat and hub running costs, but not the rate used for gas-heating savings. |
| Typical consumption profile | 9,500 kWh gas and 2,500 kWh electricity [1] | A comparison profile, not a promise that any particular home will use these amounts. |
| Temporary VAT change | Electricity VAT falls from 5% to 0% from October 1, 2026 through March 31, 2027 [1] | Direct bill comparisons across the change can show a reduction even when electricity consumption has not fallen. |
Ofgem describes the £60 movement as roughly 4%, while MoneySavingExpert reports it as 3.6%; that is a rounding difference around the same change, not a disagreement over the new £1,723 figure.[1][2] Figures of about £1,935 use the older typical-consumption definition of 2,700 kWh electricity and 11,500 kWh gas, so they should not be placed beside the new headline without explaining the different denominator.[3]
What the main smart-heating savings claims actually measure
A percentage only becomes useful after identifying its denominator. A 10% reduction in space-heating energy is not automatically a 10% reduction in the whole gas bill: gas can also provide hot water and cooking, while the standing charge does not fall when consumption falls.
The pound conversions below use a normalized baseline of 1,000 kWh of measured gas used for space heating. At 7.97p/kWh, that block costs £79.70. Scale the result to the home’s own heating-energy baseline rather than applying it to Ofgem’s entire 9,500 kWh gas profile.
| Provenance | Reported result | Value at 7.97p/kWh | How to use it |
|---|---|---|---|
| Independent US field data: ENERGY STAR | Smart thermostats save about 8% on heating and cooling bills, or roughly $50 a year. Certification requires at least an 8% heating and 10% cooling run-time reduction.[4] | £6.38 per 1,000 kWh, if the home genuinely achieves an 8% reduction in measured gas space-heating input. | A useful conservative benchmark, but not a UK field result and not evidence that every certified thermostat saves 8% in every home. |
| UK rule of thumb: Energy Saving Trust | Turning the thermostat down by 1°C can reduce heating energy by about 10%.[5] | £7.97 per 1,000 kWh of space-heating gas. | Use when the control setup sustains a real 1°C reduction. It is a rule of thumb, not a guaranteed household outcome. |
| Manufacturer customer studies: Nest | Nest reports 10–12% heating savings and 15% cooling savings, worth about $140 annually, based on two studies of Nest customers.[6] | £7.97–£9.56 per 1,000 kWh of gas space heating at the reported 10–12% range. | Treat as an optimistic ceiling for heating, not as independent UK evidence. Customer studies can reflect who bought and continued using the product. |
| Manufacturer internal analysis: ecobee | A 2013 ecobee analysis claimed savings of up to 23%, or about $200 a year.[6] | No UK gas conversion: “up to” savings are not a sufficiently defined heating-energy denominator. | Do not plan a budget around the top-line percentage. |
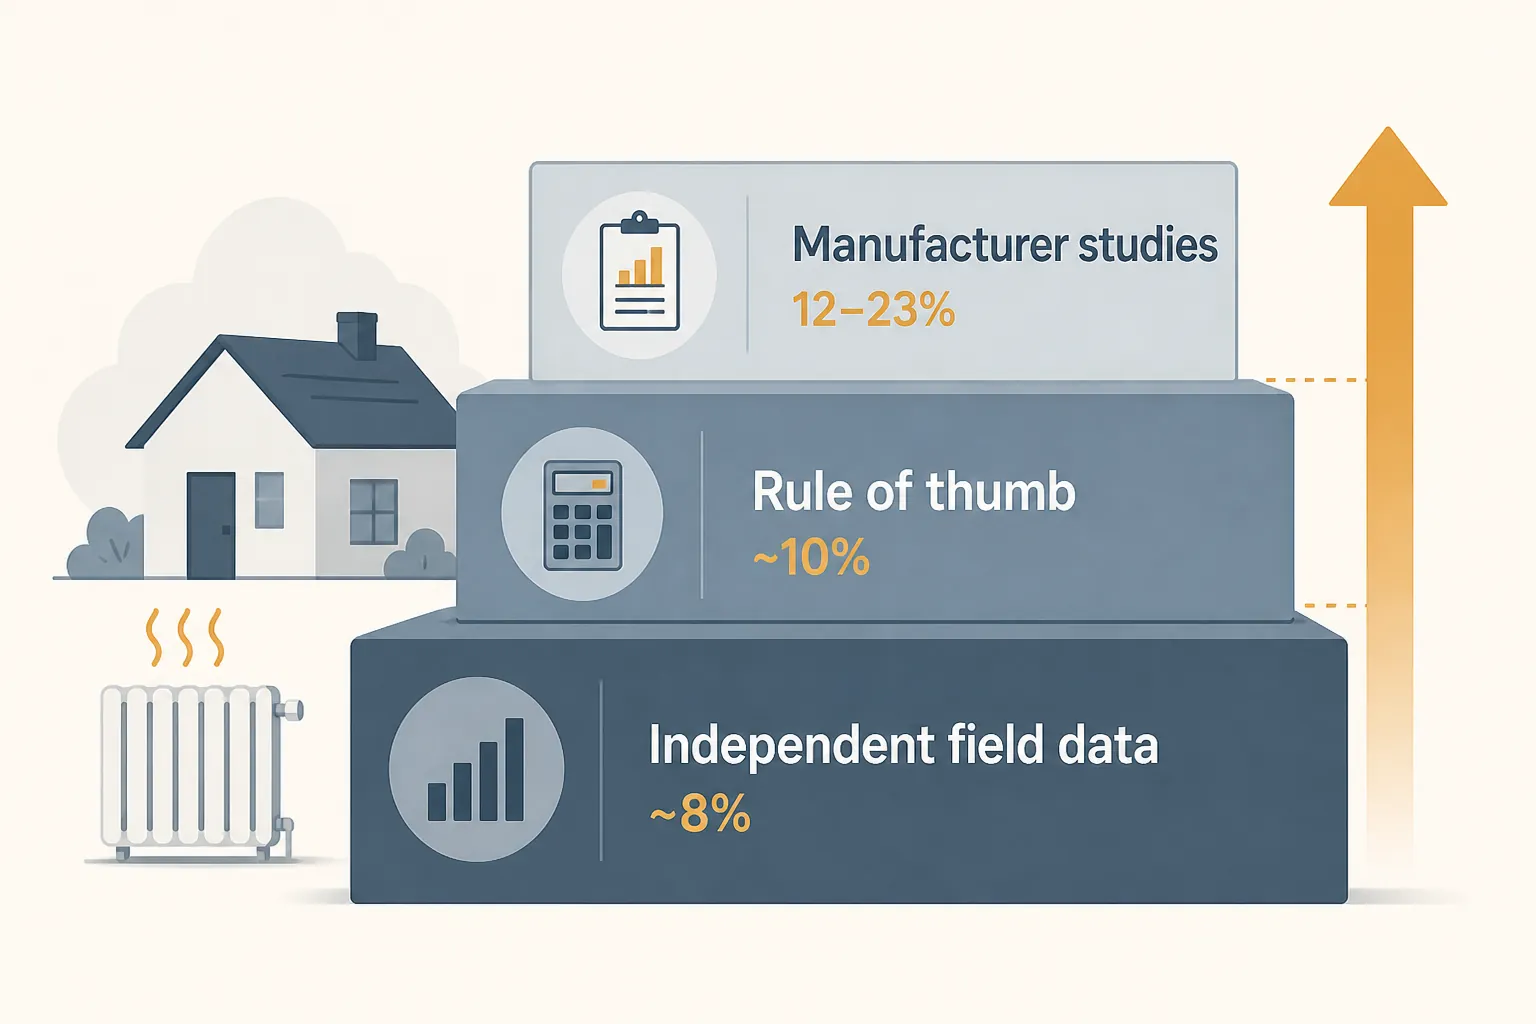
The 8–10% range is therefore a working expectation, not an average of the four rows. Its lower end comes from independent field evidence, albeit from the US; its upper end is supported by a UK temperature rule that requires an actual, sustained setback. Nest’s 10–12% sits just above that range, but its provenance is weaker. Ecobee’s “up to 23%” is a possible high-end manufacturer outcome rather than a sensible forecast.
For more detail on why percentages from laboratory models, customer studies and field data should not be treated as interchangeable, see the guide to reading smart-home energy-saving claims.
Build the heating workflow in the right order
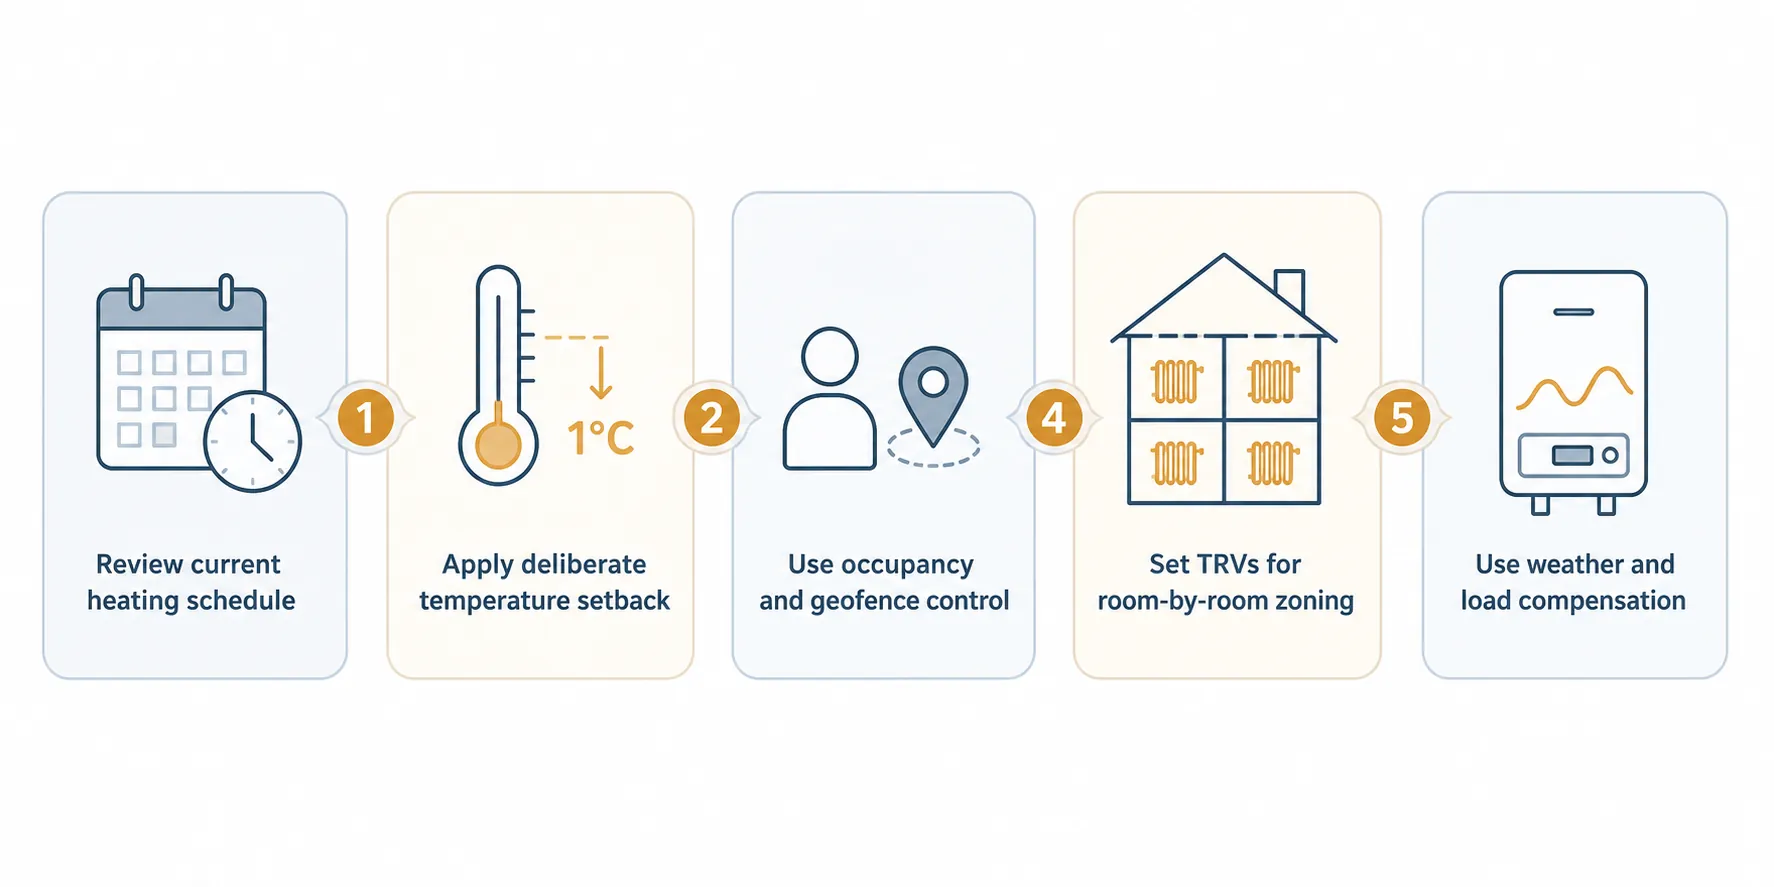
| Sequence | Action | Evidence to collect |
|---|---|---|
| 1 | Establish the current heating schedule before adding automation. | Setpoints, heating periods, manual overrides and gas consumption. |
| 2 | Apply the 1°C rule deliberately where comfort permits. | Whether the lower setpoint remains in place rather than being repeatedly overridden. |
| 3 | Add occupancy or geofence control. | False-away events, unnecessary preheating and household members left out of the logic. |
| 4 | Use smart TRVs to zone rooms around actual use. | Room temperatures, valve demand and whether people routinely reopen or boost closed zones. |
| 5 | Consider weather or load compensation for the boiler. | Compatibility, flow-temperature behavior and comfort during changing outdoor conditions. |
Start with the schedule people really keep
Before changing anything, write down the current weekday and weekend schedule, every target temperature and the times when someone usually presses Boost or Hold. Those interventions are not noise to be ignored. They reveal where the programmed schedule disagrees with the household.
Begin with the dependable occupied periods: getting up, returning home and using the main living space. Remove heating periods that survive only because they came with a default template. Then check whether the system starts early enough to reach the target when needed, rather than compensating with an unnecessarily high setpoint.
Do not change every day, room and temperature simultaneously. A schedule that looks efficient in the app can become less efficient if cold occupants repeatedly boost it above the original target. Make one meaningful change, observe whether it survives normal use, and only then add another.
Platform-specific starting points belong in the seasonal smart-thermostat settings guide. Also verify the thermostat, hub and phone time zones after the clocks change. Heating schedules are particularly noticeable casualties of a one-hour shift; use the daylight-saving schedule fix if events begin firing at the wrong time.
Use the 1°C rule as a controlled change
Energy Saving Trust’s roughly 10% rule applies to heating energy when the thermostat is turned down by 1°C.[5] It does not mean that installing an app or enabling a learning mode creates the same reduction.
Choose the occupied-period setpoint you want to test, reduce it by 1°C, and leave the rest of the schedule stable long enough to discover whether the household accepts it. If everyone overrides the change each evening, record that result and restore a workable temperature. A smaller sustained reduction is more credible than a larger setting that exists only until the first manual boost.
Make occupancy control answer to the whole household
Geofencing can remove heating when the home is genuinely empty, but its assumptions need inspection. Check whose phone counts, what happens when location permission is denied, how the system treats a flat battery, and whether someone working at home can be marked away when another person leaves.
Set a visible fallback schedule before enabling location automation. The fallback should keep the home usable when the service, hub or phone fails. Then review the event history for three practical errors:
- Away mode starts while someone is still home.
- Heating resumes so late that the occupant immediately uses Boost.
- A short trip triggers a setback followed almost immediately by recovery heating.
Adjust the location boundary, participating phones or recovery timing in response to those events. If the errors remain routine, a predictable schedule may produce a more repeatable behavior change than geofencing. Convenience counts when it prevents waste without prompting later overrides; the automation label itself does not.
Zone rooms according to use, not room names
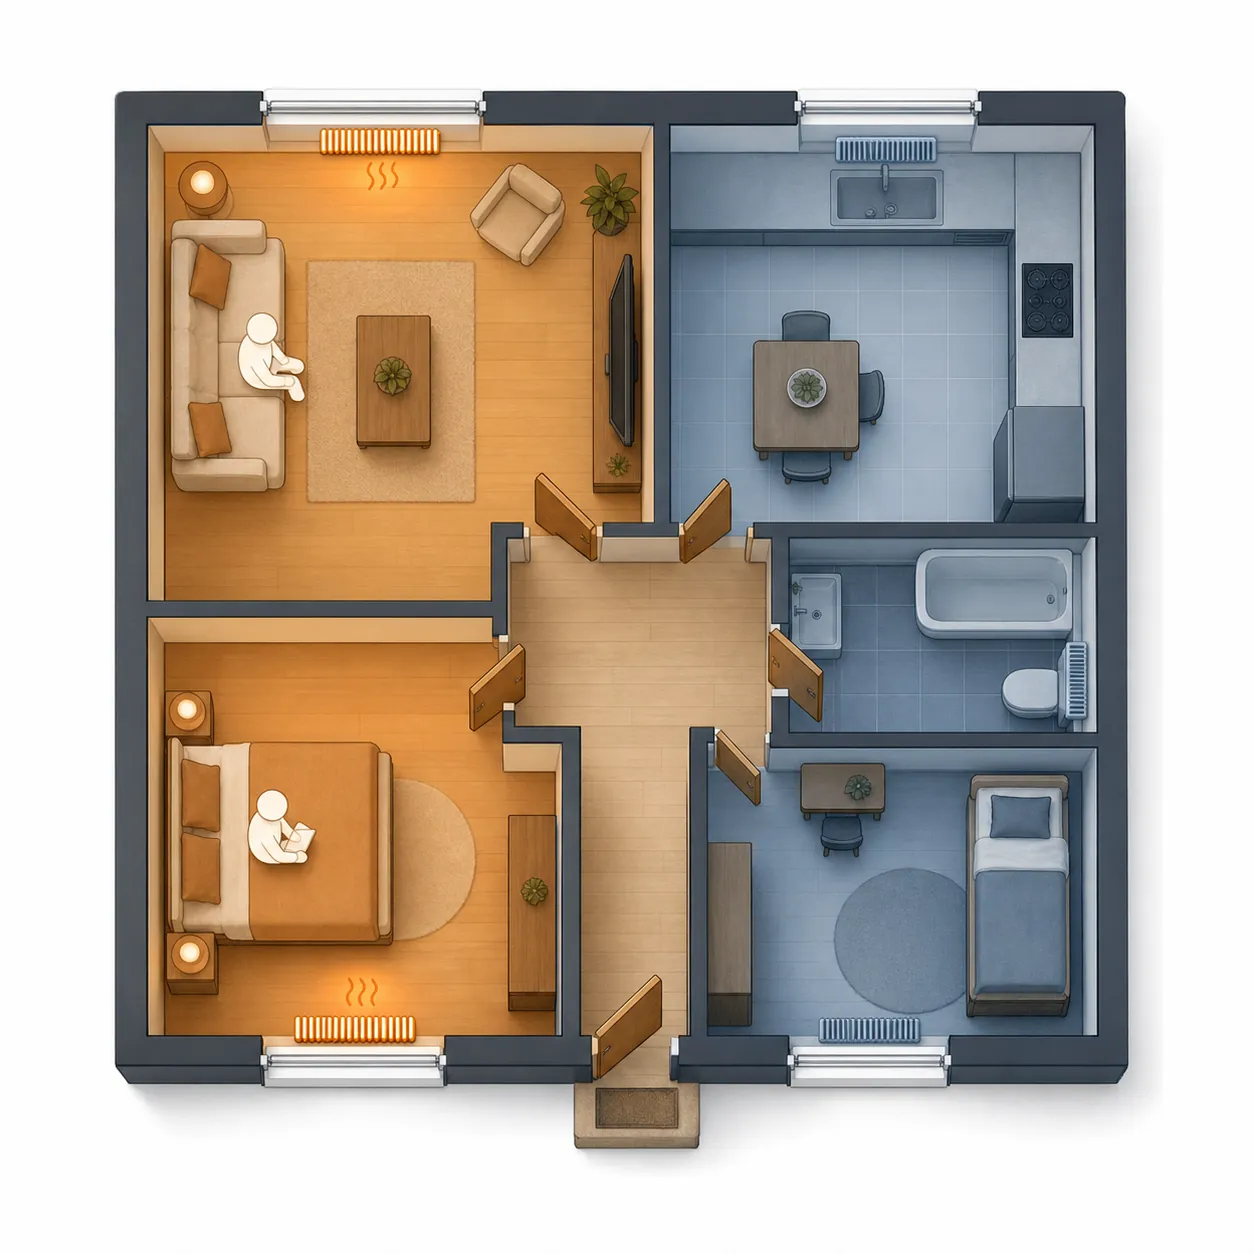
Smart thermostatic radiator valves allow individual rooms to follow different temperatures and schedules, making it possible to reduce heat in rooms that are not being used.[7][8] That capability is most useful where occupancy genuinely differs: a spare bedroom, a study used only on certain days, or bedrooms that do not need the living room’s evening schedule.
Build each room schedule from observed use. A room called “office” may be occupied all week, occasionally or never; its name says nothing about its heating demand. Start with the rooms whose unused periods are obvious, then extend zoning only after those schedules work.
- Check whether each TRV merely limits its radiator or can also request heat from the boiler through the main controller.
- Verify that the thermostat’s reference room and the TRV schedules do not issue contradictory demands.
- Keep a record of rooms that are repeatedly boosted, reopened or switched to manual control.
- Review irregular-use rooms separately rather than copying one weekday template across the house.
A fitted TRV is still only a control. It becomes an energy-saving measure when it maintains a lower temperature or shorter heating period than the room would otherwise have had. If a valve remains fully open, follows the whole-home thermostat or is constantly overridden, its presence should not be counted as a saving.
Treat boiler compensation as a separate control layer
Weather compensation adjusts boiler flow temperature in response to outdoor conditions, while load compensation varies it in response to the home’s heating demand. These controls can help a compatible boiler avoid producing unnecessarily hot water for the radiators when a lower flow temperature can meet the demand.[7][8]
Compensation may be available without installing a smart thermostat, so do not fold its effect into the thermostat’s advertised saving. Ask the boiler manufacturer or heating engineer which controls and communication methods the boiler supports. After configuration, observe comfort and boiler behavior during both mild and colder weather rather than assuming one fixed flow-temperature setting will suit every condition.
Test the reduction against the home’s own baseline
Use meter readings or supplier consumption data, not the change in the Direct Debit amount. Prices, account balances and the temporary electricity VAT cut can all move the bill independently of consumption. Gas data also includes any gas used for hot water and cooking, so label a whole-meter comparison as a change in total gas use unless the heating portion can be isolated.
Record the old schedule and setpoints, the date of each control change, gas consumption, broadly comparable weather, and the number of manual overrides. Compare similar occupied periods and avoid claiming a thermostat saving when holidays, building work or unusually mild conditions provide a simpler explanation.
Where a heating-energy baseline is available, calculate the result directly: baseline heating kWh × measured percentage reduction × £0.0797. For example, every verified 100 kWh reduction in gas use is worth £7.97 at the October unit rate, before considering any tariff-specific differences. The standing charge remains unchanged.[1]
Standby schedules, smart plugs and broad quick wins are covered in the beginner smart-home energy recipes. If the controls have not yet been purchased, use the separate smart-device payback guide to compare purchase costs with defensible savings.
Expect roughly 8–10% only where schedules, setpoints, occupancy logic or zoning create a sustained reduction in heating demand. Treat 12–23% manufacturer figures as upper bounds rather than household forecasts. A geofence that is routinely corrected and a TRV that remains overridden are functioning controls, but they are not evidence of savings.
References
- Energy price cap unit rates and standing charges. Ofgem, August 26, 2026.
- What is the Energy Price Cap?. MoneySavingExpert.
- October energy price cap announcement due this week. Uswitch.
- ENERGY STAR Smart Thermostats FAQs for EEPS. ENERGY STAR.
- Quick tips to save energy at home. Energy Saving Trust.
- Is a Smart Thermostat a Worthwhile Investment for Your Home?. What is Smart Energy?
- 6 ways energy smart homes can save energy. British Gas.
- Are smart homes the key to a lower carbon footprint?. Energy Saving Trust.