How Much Energy Does Bioclimatic Smart Home Design Save?
Smart-home savings claims range from a credible 8% to an unverified 80%, and the difference comes down to how each number was measured. Grounded in bioclimatic design principles, this guide shows which results field data actually supports for thermostats, shades, monitoring, and whole-home systems — and how to read any percentage before buying.
Last updated
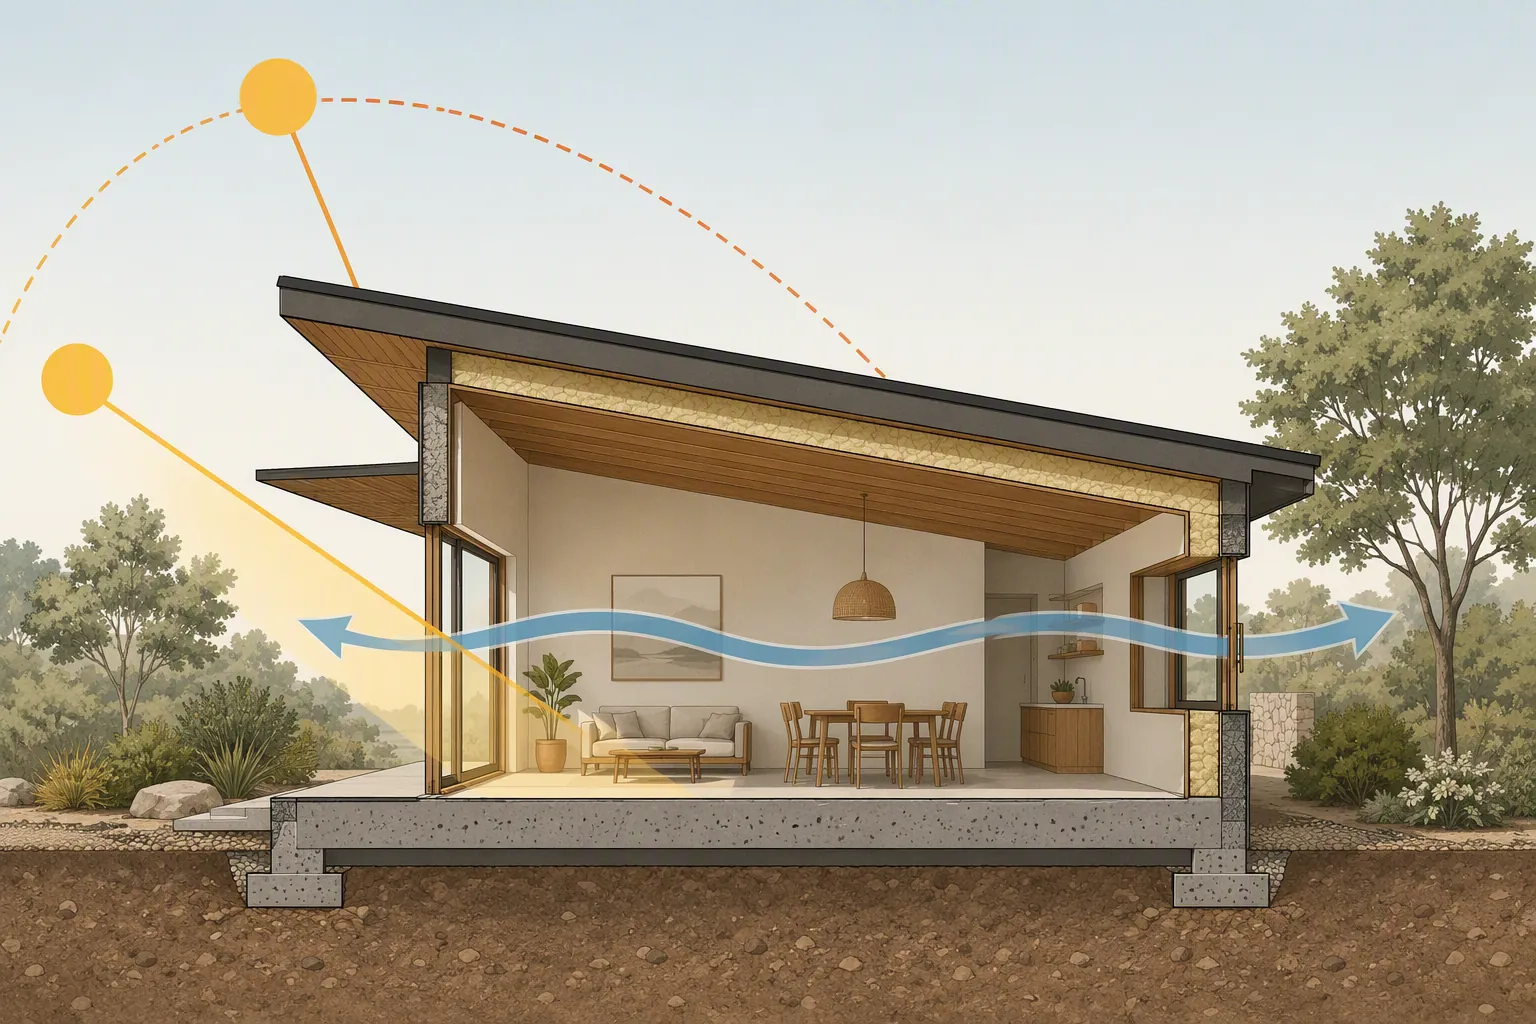
The energy-saving story starts before the first thermostat wakes up. A house that faces the right way, blocks high summer sun, accepts low winter sun, holds heat in insulated walls, uses thermal mass wisely, and opens to cross-ventilation has already done the hard work that most smart devices can only help manage. Bioclimatic architecture is that climate-aware starting point: orientation, solar gain, shading, insulation, thermal mass, and ventilation arranged so the building needs less mechanical heating and cooling in the first place. That matters because buildings account for roughly 36% of global energy use, and passive standards such as Passivhaus set demanding caps around heating, cooling, and primary energy demand rather than celebrating a clever app by itself.[1]

That distinction prevents a lot of expensive disappointment. A smart-home energy-saving design can make a good building behave better: lower shades before afternoon solar gain, pre-cool only when it helps, open vents or windows when outdoor air is useful, and avoid heating or cooling rooms on autopilot when nobody needs them. It cannot turn a west-facing glass wall with no shading into a passive house by software update.
This is why the most useful question is not which smart device saves the most. It is what kind of measurement produced the percentage. A design-stage bioclimatic estimate, a commercial shade study, a utility pilot in 15 homes, a national thermostat field-data method, and a dashboard behavior study are not interchangeable evidence.
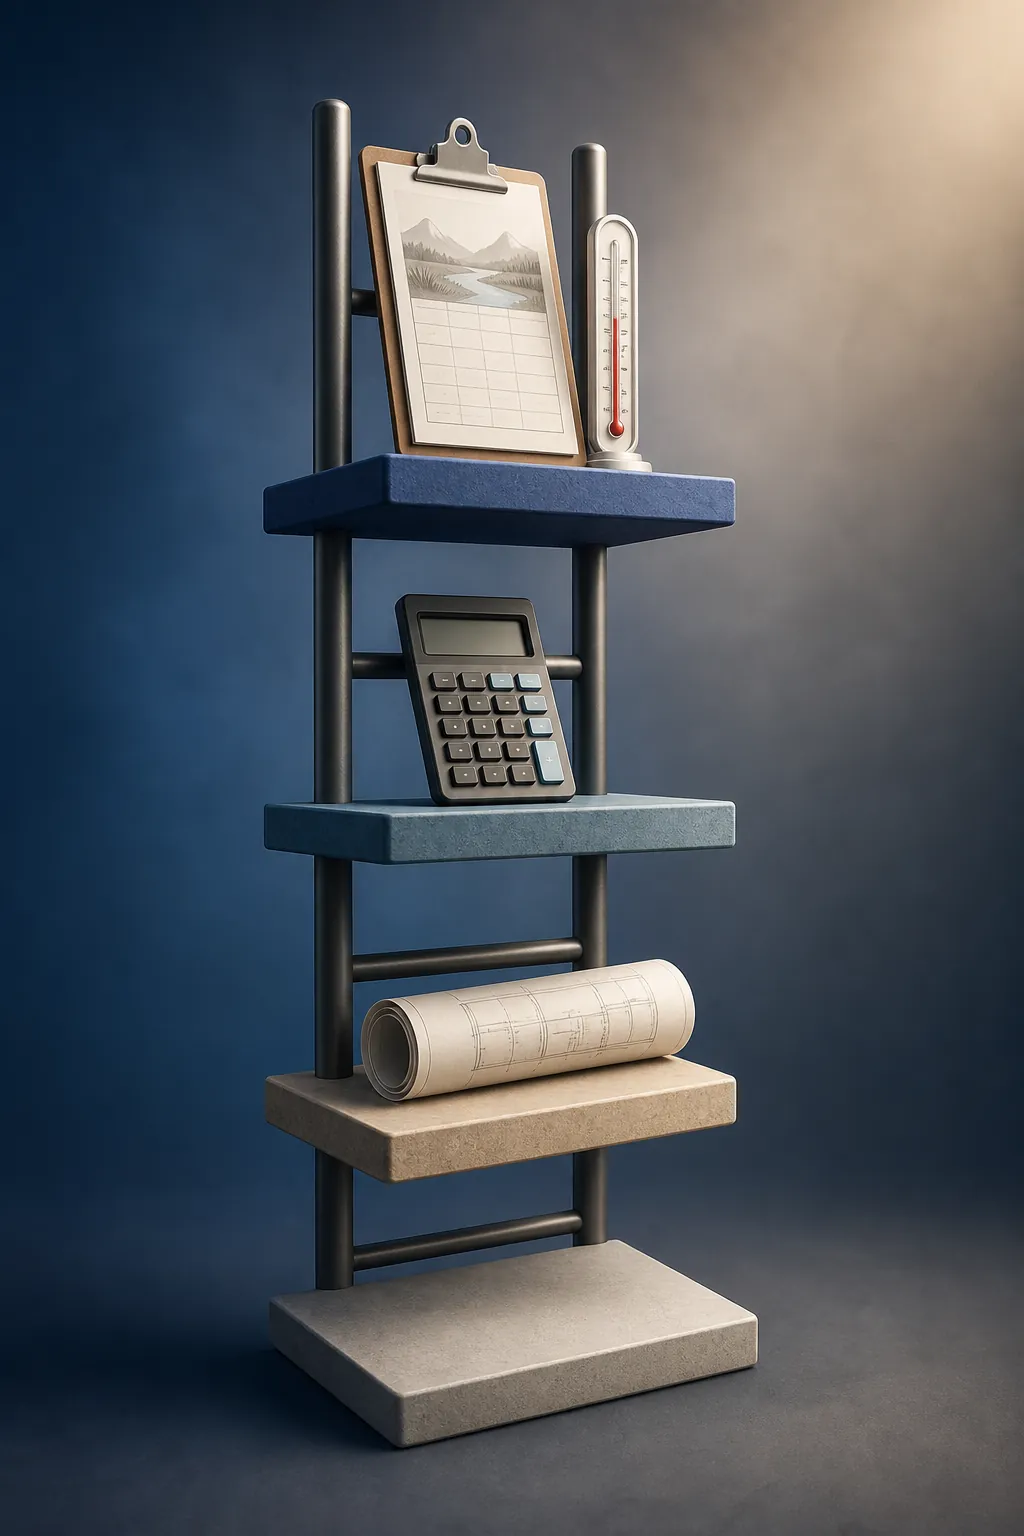
The evidence ladder behind the savings claims
Before buying anything, put the percentage on a ladder. Field data from many installed homes belongs higher. A field study in one kind of building can still be valuable, but it travels less cleanly. A design estimate can be useful for architecture, but it should not be read as proof that a gadget will cut an existing utility bill by the same amount.
| Savings claim | What measured it | How a buyer should read it |
|---|---|---|
| Up to 50% from bioclimatic design | A design-stage estimate attributed to Spain’s IDAE, not a smart-device field result.[2] | Useful for understanding the value of climate-aware architecture; not proof that a retrofit device will halve your bill. |
| Roughly 8% for ENERGY STAR certified smart thermostats | A national field-data certification method tied to heating and cooling run-time reductions.[3] | The cleanest buyer-relevant number here, but it applies to heating and cooling bills, not necessarily the whole home. |
| 13.5% to 25% for automated insulating shades | Field results from different contexts: a residential utility pilot, a 44-week study, and a commercial high-rise study.[4][5][6] | Promising, especially when shades control real heat gain, but building type, window exposure, climate, and control logic matter. |
| 0% to 18% for monitoring-only systems | A review of monitoring and smart-home energy interventions, with stronger ranges when monitoring is paired with control.[7] | A display can help, but it saves little if nobody changes a load or an automation does not act. |
| Around 30% for whole-home systems | A weaker category claim unless tied to a specific field method, device package, home type, and measured load. | Treat as a prompt to ask for evidence, not as a planning number. |
| Up to 80% in broad smart or bioclimatic marketing | Not supported by a primary field-data source in this evidence set. | Do not compare it directly with measured thermostat or shade savings. |
The table is deliberately uneven because the evidence is uneven. A precise-looking percentage can still be weak if nobody says whether it came from modeled design performance, measured utility bills, HVAC run time, or a narrow pilot. The measurement boundary is part of the claim.
Bioclimatic design gives smart devices better work to do
The elegant version of a bioclimatic architecture smart home energy saving design is not a wall of screens. It is a house where the control layer understands the passive strategy. In winter, low sun may be welcome through the right windows. In summer, the same glass may need a shade before the room overheats. If outdoor air is cooler than indoor air, ventilation can do work that the compressor would otherwise do.
For an existing home, that usually means asking where the big thermal loads are before buying the controller. Heating and cooling can represent 20% to 50% of home energy use in the Australian government’s YourHome guidance, so controls that reduce HVAC demand are working near one of the larger targets, even if the exact share in a U.S. home will depend on climate, equipment, insulation, and behavior.[8]
The same guidance is also refreshingly practical about automation. Smart controls can support passive solar heating and cooling by operating blinds, awnings, windows, vents, and fans. That is the part worth paying attention to: the device is useful when it moves a physical condition in the house, not merely when it reports that the house is uncomfortable.[8]
Smart thermostats: the most portable savings number is also the least dramatic
ENERGY STAR’s smart thermostat number deserves attention precisely because it is not theatrical. The program says certified smart thermostats save about 8% on heating and cooling bills on average. Its certification method is based on field data, and the product must show at least 8% heating run-time reduction and at least 10% cooling run-time reduction under the EPA method.[3]
That number is limited in all the right ways. It is about heating and cooling, not the whole electric bill. It is an average, not a promise for a specific house. It says nothing by itself about whether your HVAC wiring supports a particular thermostat, whether your heat pump needs special lockout settings, or whether the household will override the schedule every evening.
For a buyer, that makes 8% more useful than a louder claim with no method. If the current thermostat is already programmed carefully and the house has stable occupancy, savings may be modest. If the existing schedule is chaotic, if the thermostat can avoid unnecessary run time, or if it coordinates with pre-cooling and passive cooling habits, the device has more room to help. The percentage still belongs to HVAC operation, not to every plug, light, appliance, and standby load in the house.
The purchase check comes before the savings check. A thermostat that cannot be installed correctly is not an energy measure. If you are still sorting device fit, use a thermostat comparison as a shortlist, then verify the wiring and equipment side with a smart thermostat HVAC compatibility check before trusting any savings estimate.
For those next steps, see our smart thermostat comparison and HVAC compatibility guide.
Automated shades: larger results, tighter context
Shades are where the numbers get more exciting, and also where the fine print starts doing heavier work. Automated insulating shades can change solar gain and heat loss directly. That gives them a pleasingly physical relationship to bioclimatic design: less unwanted heat enters, less conditioned air is demanded, and the thermostat has less cleanup to do.
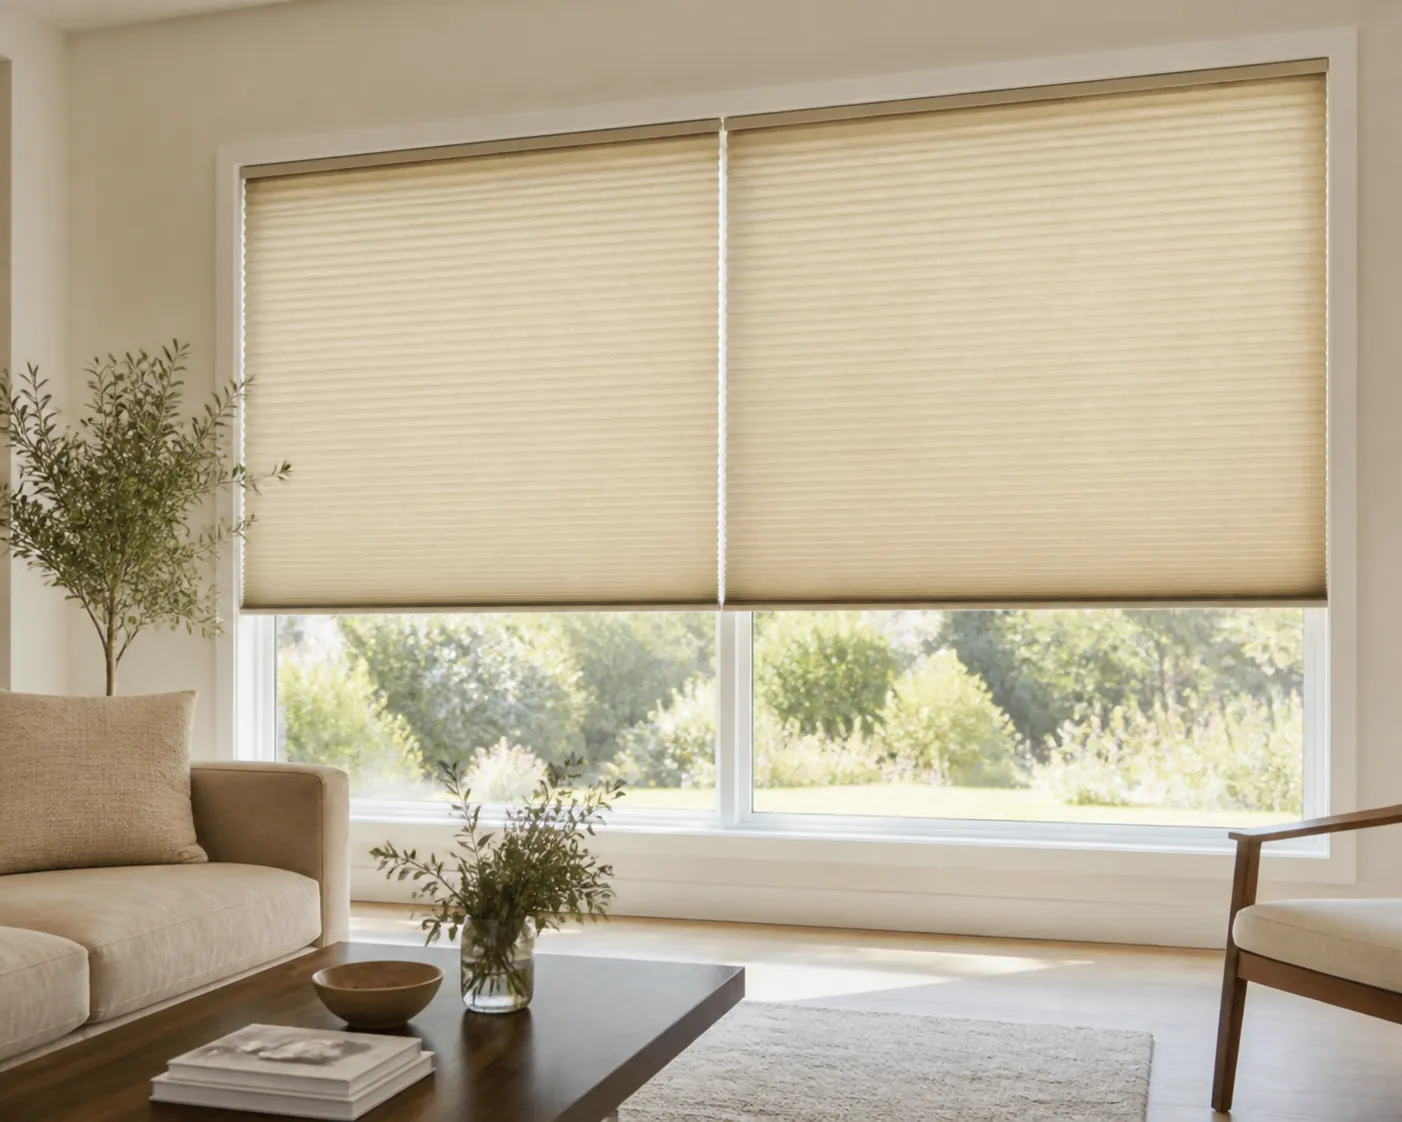
Illinois Tech reported a Willis Tower study finding 25% energy savings from automated window shades, with an estimated 3- to 5-year payback. That is a serious result, but the building context is a commercial high-rise, not a detached house with different glazing, schedules, internal gains, and HVAC controls.[4]
A separate 44-week Applied Energy study found that automated shades delivered up to 20.5% daily savings compared with 11.8% for manual operation, and reported 20% to 35% weather-normalized annual savings. Again, the method matters: daily results, annual weather normalization, automated versus manual comparison, and the study’s specific building conditions all shape what the percentage means.[5]
The residential result that feels closest to a homeowner’s decision is the AERC and Baltimore Gas & Electric pilot. It involved 15 homes and reported more than 13% savings on electric bills, often summarized as 13.5%, using smart cellular shades controlled by a schedule plus sun-position logic.[6]
That control logic is the useful part to copy. A shade that lowers only after the room is already hot is late. A shade that follows a fixed schedule may miss cloudy days, unusual occupancy, or seasonal sun angles. Schedule plus sun position is closer to actual passive design: anticipate solar gain, block it when it is unwanted, and avoid closing the room into a cave when daylight is harmless or helpful.
Still, shade percentages should not be flattened into one universal promise. South-facing glass in a cooling-dominated climate, west-facing afternoon exposure, leaky old windows, highly insulated windows, exterior versus interior shading, cellular shade R-value, and occupant overrides can all change the outcome. A strong shade study tells you that the control strategy can work. It does not tell you that every window in every house deserves the same motorized treatment.
If you are building automations around weather and sun rather than buying a full shade package at once, our guide to weather-triggered smart-home automations is the more relevant next stop than a generic smart-home benefits list.
Energy monitoring: useful evidence, weak lever by itself
Energy monitors are tempting because they make invisible consumption visible. They can show a standby load, an appliance pattern, or an HVAC spike that would otherwise hide in a monthly bill. The savings evidence is thinner when monitoring is the main intervention. A review found monitoring-only outcomes ranging from 0% to 18%, while monitoring combined with control showed a stronger 3% to 26% range.[7]
That difference is exactly what shows up in real kitchens and living rooms. A dashboard can tell someone the dryer ran during a peak period; an automation can delay a flexible load. A monitor can show that cooling demand jumps in late afternoon; shades and thermostat logic can reduce that jump. Information helps most when it shortens the path to an action.
The same review also flags rebound effects, including evidence of energy intensification in some smart homes. That is the awkward part many product pages skip: if a household uses automation to become more comfortable, runs more devices, or stops paying attention because the system feels efficient, technical savings can shrink or disappear.[7]
So monitoring earns its keep when it leads to load control, equipment repair, schedule changes, or a better automation. It is less convincing as a standalone purchase justified by a large percentage on the box.
Whole-home systems are a category, not a single savings number
Whole-home energy management sounds tidy until you ask what is actually included. One system may only monitor circuits. Another may coordinate a thermostat, plugs, solar production, battery charging, EV charging, flexible loads, and utility signals. Those are different machines wearing the same broad label.
YourHome’s HEMS framing is helpful because it treats the category as tiers: monitoring, basic control, sophisticated control, and orchestrated control. The movement up the ladder is not cosmetic. A system that merely displays energy use is not doing the same job as one that can coordinate HVAC, appliances, generation, storage, and demand response.[8]
SEPA describes a similar progression through four levels of autonomous home energy management, from lower automation toward systems that can make more decisions across home energy resources. ENERGY STAR’s Smart Home Energy Management Systems category also frames energy management as a package of connected devices rather than a single magic controller.[9][10]
This is where claims around 30% need to be handled with care. A whole-home percentage without the device bundle, baseline, climate, rate structure, building type, and measured loads is not a planning number. It may describe a particular scenario with solar, storage, demand response, HVAC optimization, or behavioral change. It may also be a secondary claim repeated without the measurement story a buyer needs.
There is also a small but real subtraction to remember. Automation has its own standby load. YourHome gives a 20- to 50-watt standby-load range for smart-home automation. That does not erase meaningful HVAC or shade savings, but it belongs in the arithmetic, especially when a system mainly adds hubs, sensors, and always-on electronics without controlling a major load.[8]
What to ask before trusting an energy-saving percentage
A good savings claim can survive ordinary questions. A weak one starts changing shape as soon as you ask what was measured. Before paying for a thermostat, motorized shades, an energy monitor, or a whole-home energy system, ask the vendor or installer to place the number in a measurement frame.
- Was the percentage measured in occupied buildings, modeled during design, or estimated from a simulation?
- Was it based on utility bills, HVAC run time, electricity only, gas plus electricity, peak demand, or a single load?
- Was the building a single-family home, apartment, commercial office, high-rise, or pilot home sample?
- Was the baseline a badly managed home, a typical home, or an already efficient home?
- Did the study include occupant overrides, rebound effects, and comfort changes?
- Does the claim count automation standby load?
- Is the percentage for the whole home, for heating and cooling, for electric bills, or for one control strategy?
The practical buying order follows from those questions. Fix the building basics where possible: shading, air sealing, insulation, window exposure, ventilation habits, and HVAC sizing or maintenance. Then choose smart controls that act on the largest loads and fit the building’s passive strategy. A thermostat can reduce unnecessary HVAC run time. Shades can prevent avoidable solar gain. Monitoring can reveal waste, especially when paired with control. Whole-home systems can coordinate more, but only when the package is clearly defined.
For cooling-heavy homes, shade and ventilation automations may be more useful than another dashboard. Our smart-home cooling without AC guide goes deeper into that passive-control side.
The safest conclusion is not that a bioclimatic smart home saves one universal amount. The safer conclusion is that measured savings become believable only after the source, method, building context, and scope are visible. An 8% thermostat result with a field-data method may be more useful than a glamorous 50% or 80% claim with no bill-based measurement behind it. A 13.5% shade pilot can be compelling without becoming a promise for every window. A monitor can be worthwhile without pretending that awareness alone is control.
Buy the control layer that matches the building you actually have, and read every percentage as a measured claim, not a wish.
References
- Bioclimatic architecture and Passivhaus, Iberdrola
- Bioclimatic architecture: efficient design, Moeve
- Smart Thermostats: Frequently Asked Questions, ENERGY STAR
- Automated Window Shades Show Potential for Significant Energy Savings, Illinois Tech Study Finds, Illinois Institute of Technology
- Applied Energy 44-week automated shading study, ScienceDirect
- Nation’s First Smart Shade Pilot Program Yields Over 13% Savings on Electric Bills, Attachments Energy Rating Council
- Smart home energy management review, arXiv
- Smart homes, YourHome
- The 4 Levels of Autonomous Home Energy Management, Smart Electric Power Alliance
- Smart Home Energy Management Systems, ENERGY STAR
Known issues with this device / protocol
Spec-version history
For active regressions on this protocol, see Update Watch.
No linked Update Watch entries yet.