Smart Home Energy Saving After the October 2026 Price Cap
The October 2026 energy price cap raises typical dual-fuel bills to £1,723 a year, but the cap only sets unit rates and standing charges — what you actually pay still follows kWh. These measured smart-home recipes (thermostat setback, standby-kill plugs, off-peak load shifting) convert the new rates (26.32p/kWh electricity, 7.97p/kWh gas) into £ savings you can verify with a dated before/after check instead of trusting vendor percentages.
The eye-catching numbers are 4% and £1,723. From 1 October 2026, that is Ofgem’s headline increase and annual figure for a typical dual-fuel household paying by Direct Debit. It is not a £1,723 ceiling on anyone’s bill. The price cap limits unit rates and standing charges; the household still pays for the energy it consumes.[1]
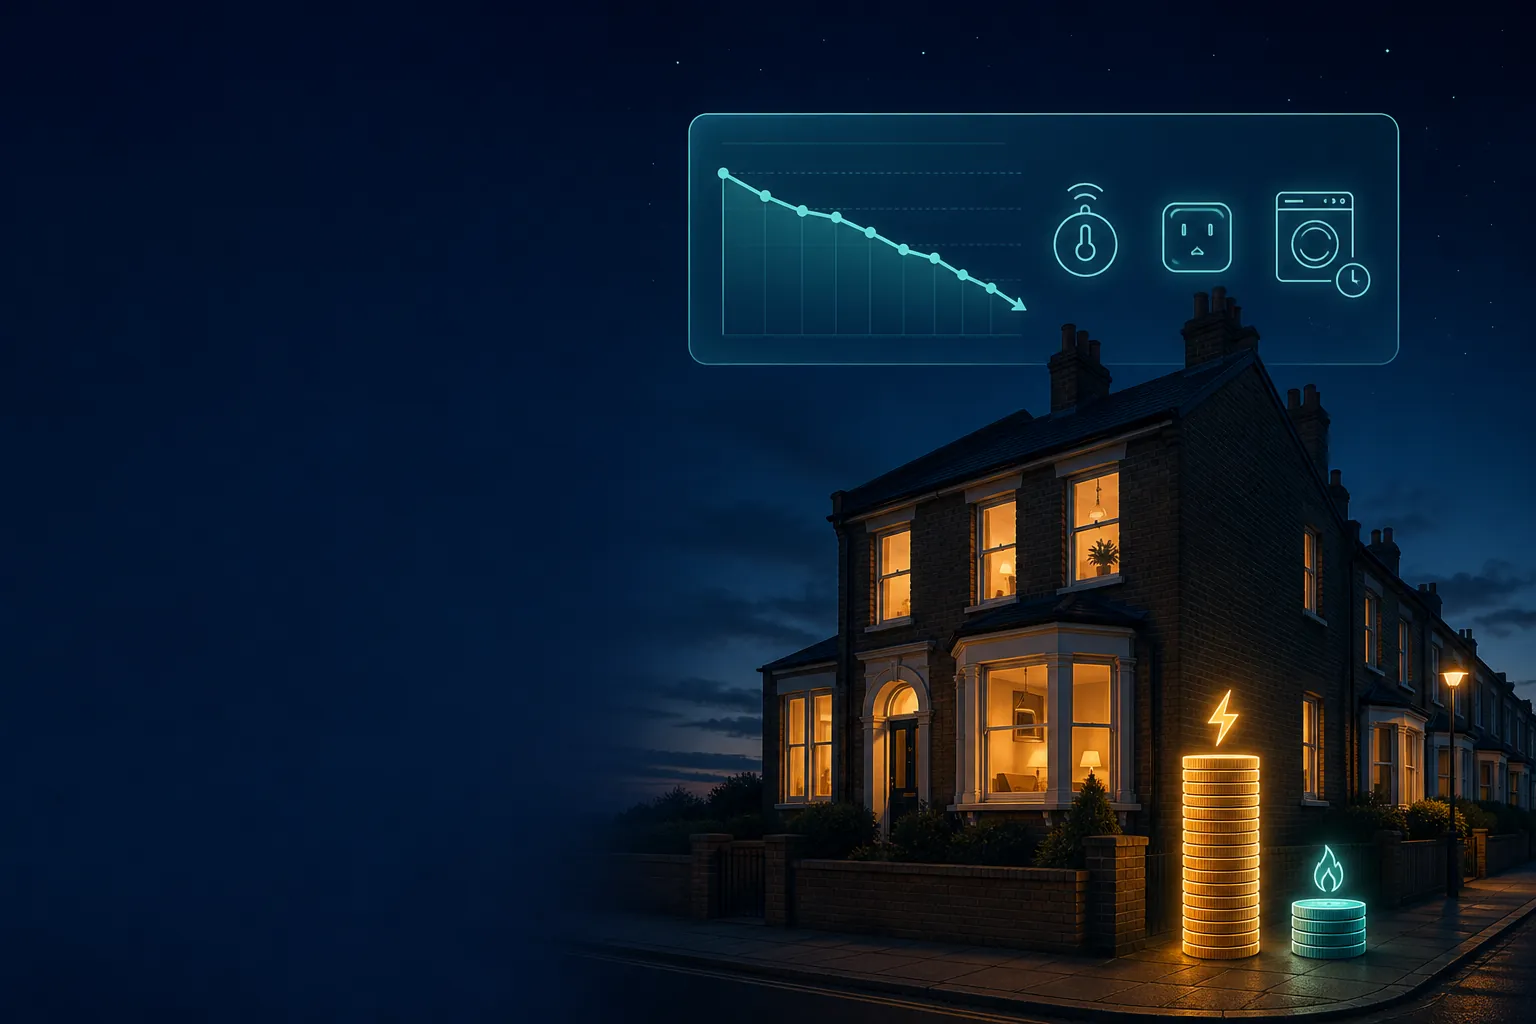
For a typical Direct Debit customer, Ofgem’s published October figures are 26.32p per kWh of electricity plus a 54.83p daily standing charge, and 7.97p per kWh of gas plus a 29.68p daily standing charge. Actual capped rates can vary by region, payment method and meter arrangement.[1][2]
The increase is chiefly gas-led: Ofgem says gas bills rise by approximately 8%, while electricity is broadly stable because VAT on domestic electricity is temporarily removed from 1 October 2026 to 31 March 2027. Ofgem puts the temporary effect at about £45; without it, the cap would be roughly £45 higher.[1]
That leaves two smart-home control surfaces. Automation can reduce consumed kWh, and an eligible time-of-use tariff can change when some kWh are bought. It cannot automate away the standing charges. Using Ofgem’s unit rates as straightforward synthesis arithmetic, each avoided electricity kWh is worth about 26.3p and each avoided gas kWh about 8.0p. Ten genuinely avoided kWh would therefore be worth £2.63 for electricity or about 80p for gas.
Some consumer coverage describes the increase as 3.6% rather than 4%. That difference reflects rounding or the consumption assumptions used to express a typical bill; the operational rates above are the figures to enter in a household calculation.[3]
The copyable measurement flow
A percentage printed on a thermostat box cannot settle whether an automation saved money in your home. The useful evidence is a dated baseline, one controlled change, a comparable after-period and the tariff rate that applied during those dates.
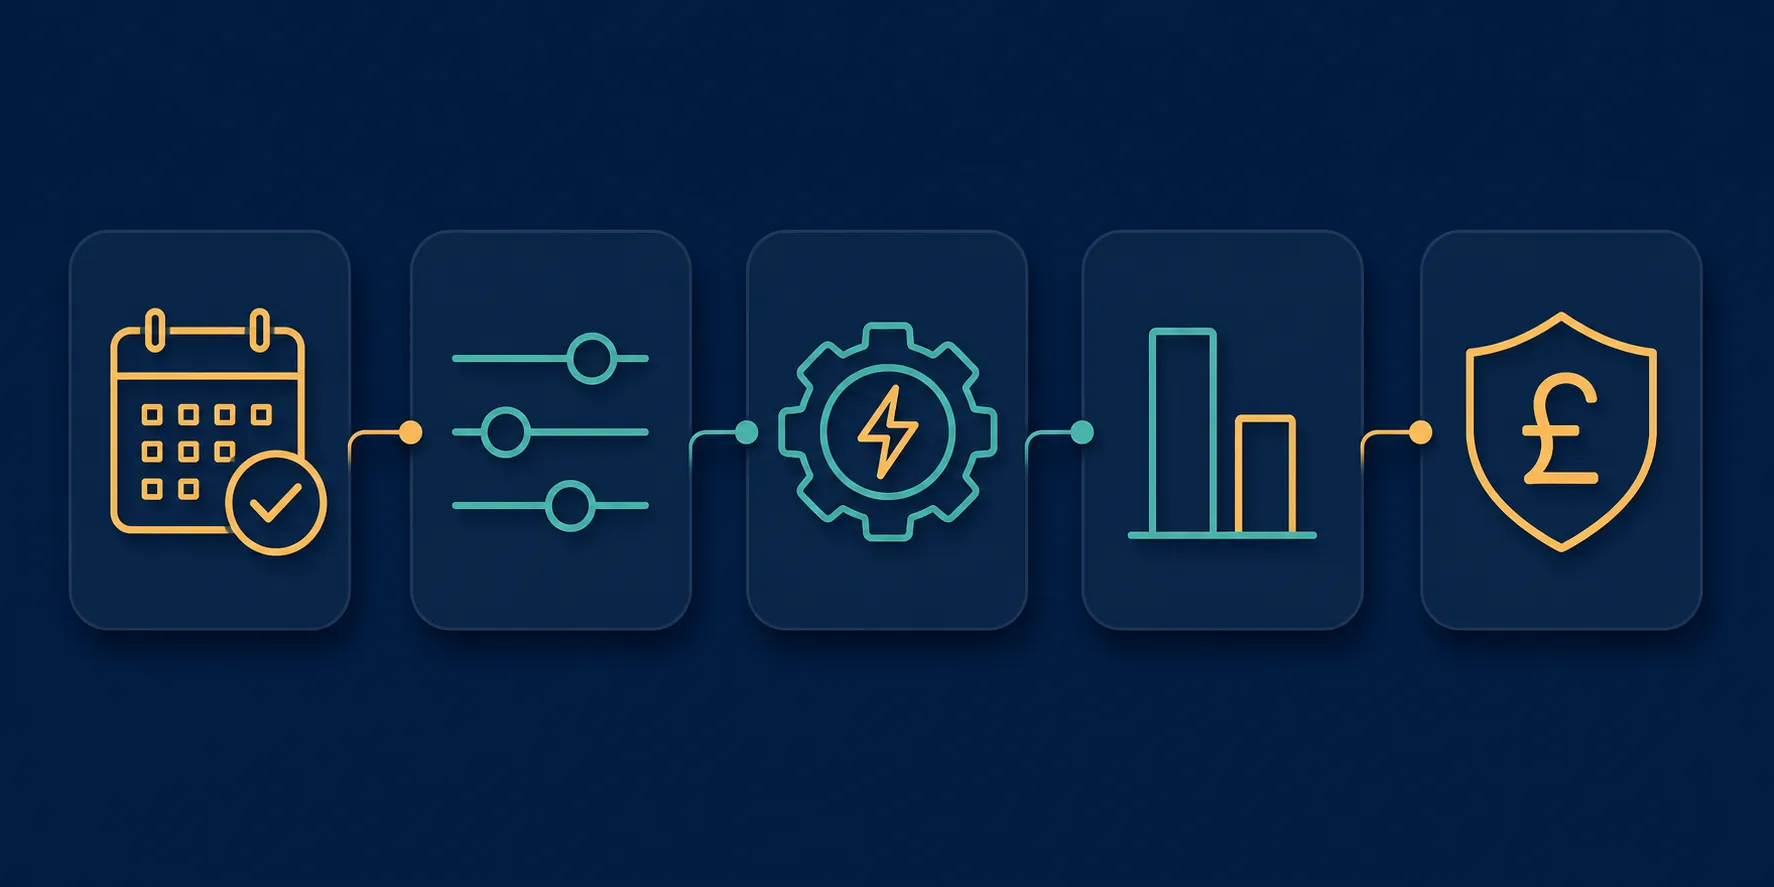
| Stage | Record or action | Why it matters |
|---|---|---|
| 1. Baseline | Save start and end dates, kWh and the relevant device or circuit | A screenshot without dates cannot be compared reliably |
| 2. Context | Record tariff, rates, hub, platform version, automation conditions and comfort settings | A tariff, firmware or configuration change can alter the result |
| 3. Controlled run | Enable one automation without quietly changing other behavior | Multiple simultaneous changes make attribution weak |
| 4. Comparison | Compare equivalent days, occupancy, weather and appliance use | A lower total is not necessarily caused by the automation |
| 5. Valuation | Multiply the measured kWh difference by the applicable unit rate or tariff-rate spread | This converts an energy or timing change into pounds |
| 6. Status | Assign Confirmed, Workaround or Investigating | The label communicates how much confidence the result deserves |
Capture a baseline that can survive scrutiny
Start with supplier smart-meter data where it is available. Record import kWh and the exact dates covered, rather than copying only the displayed cost. Supplier cost estimates may use a different tariff period, include standing charges or lag behind recent consumption.
Home Assistant can provide a more detailed ledger when its source sensors are configured correctly. Its energy dashboard supports grid consumption, returned energy, solar production, batteries and individual devices. Check that sensor units, state classes and import-versus-export directions are correct before treating a chart as evidence.[4]
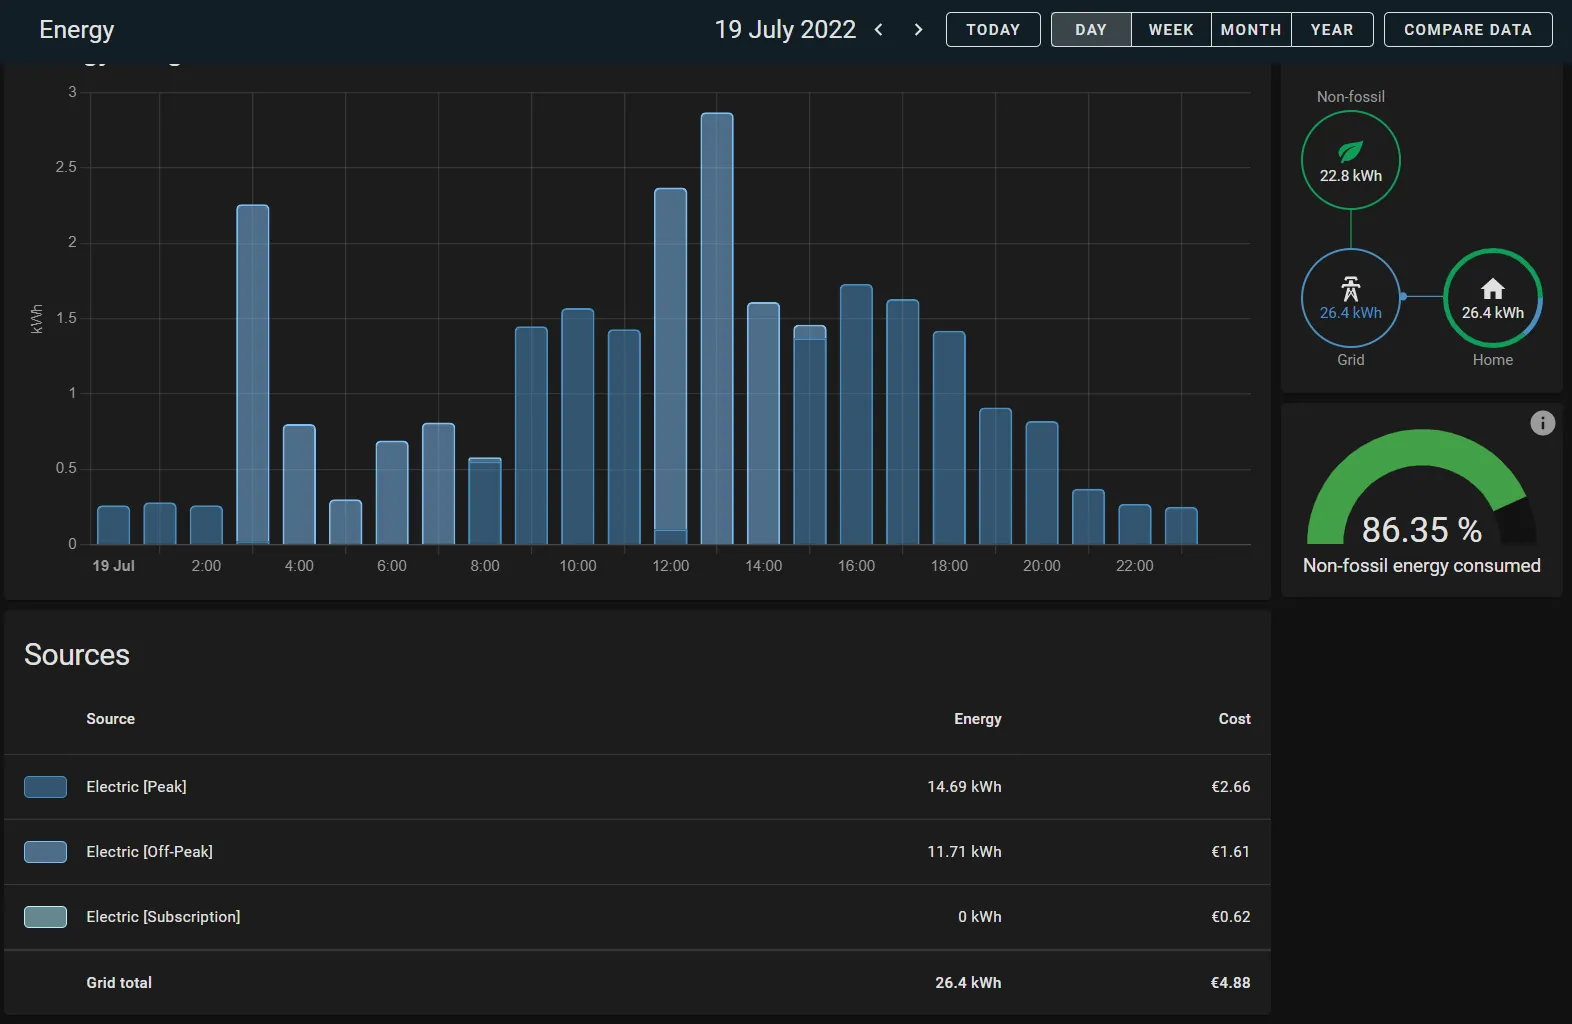
Whole-home import is sufficient only when the automation’s effect is large enough to distinguish from everything else happening in the house. Appliance-level monitoring is cleaner for a smart plug. Boiler energy data is more useful than thermostat runtime when evaluating heating, because runtime does not directly state how much gas or electricity the heating system consumed.
Record the platform conditions alongside the energy data: hub model, integration, firmware or software version, automation mode, relevant thresholds and whether processing is local or cloud-dependent. Also note occupancy, unusual guests, holidays, electric-vehicle charging and any other large load. For heating, preserve indoor target temperatures and account for outdoor conditions as far as the available data allows.
Change one behavior, then compare like with like
Do not turn down the thermostat, add standby schedules and move the dishwasher overnight on the same day if the aim is to verify each recipe. Make one material change and leave unrelated routines alone during the comparison. Choose baseline and after-periods that represent similar household use rather than selecting the most flattering pair of days.
A short before-and-after run can reveal that an automation triggers correctly. It cannot, by itself, establish a universal annual saving. Heating is especially sensitive to outdoor temperature, sunlight, wind, occupancy, hot-water use and how quickly a particular building loses heat. If those conditions differ substantially, retain the result as Investigating and collect a better comparison.
Calculate pounds without smuggling in the standing charge
- Electricity reduction on the capped rate: avoided kWh × £0.2632.
- Gas reduction on the capped rate: avoided kWh × £0.0797.
- Time-of-use shift: shifted kWh × (dated peak rate − dated off-peak rate).
- Standing charges: record them for the bill, but do not claim that an ordinary consumption automation reduced them.
Use the rate that actually applied during the measured period. The October cap rates should not be retroactively attached to a September baseline, and they should not replace the contracted rates of a fixed or time-of-use tariff.
Give the result an honest status
| Status | Use it when |
|---|---|
| Confirmed | The automation executed as intended and a reproducible kWh reduction or tariff-cost difference appears in comparable dated data |
| Workaround | The saving is measurable, but operation depends on a substitute integration, manual reset or other documented limitation |
| Investigating | The automation runs, but the energy effect is too small, too confounded or not yet repeated well enough to claim |
Recipe: a thermostat setback the household can live with
| Field | Setting |
|---|---|
| Difficulty | Moderate |
| Useful data | Gas or heating-electricity kWh, indoor setpoint, occupancy and outdoor conditions |
| Hub or protocol note | Prefer locally reported setpoints and reliable occupancy states; record cloud dependencies |
| Initial status | Investigating until comparable heating data is available |
Energy Saving Trust currently illustrates that turning a room thermostat down by 1°C, such as from 22°C to 21°C, could save about £120 a year in Great Britain. It is a useful indication that a concrete setpoint change can matter, but it is not a guaranteed outcome for an individual home or a promise tied specifically to the October 2026 cap.[5]
ENERGY STAR supplies a different kind of evidence. Its US smart-thermostat criteria require field data demonstrating an approximately 8% reduction in heating runtime, and it describes average savings of roughly 8% of heating and cooling bills, or about $50 annually. Those are conditional US figures used for product qualification. Runtime reduction is not the same measurement as gas kWh saved in a British home, and neither figure predicts your result under Ofgem’s rates.[6]
Begin with the existing occupied, sleeping and away setpoints. If the household agrees that a 1°C reduction remains comfortable, apply it first to a defined period rather than rewriting the entire schedule. A setback that prompts someone to use an electric fan heater, repeatedly override the control or tolerate an unacceptably cold room has failed the household test even if the main boiler runs less.
- Export dated heating-fuel consumption and record the thermostat schedule before the change.
- Record indoor setpoints, occupancy assumptions, hot-water scheduling and available outdoor-temperature data.
- Reduce one defined setpoint or automate an away setback while retaining frost protection and safe minimum temperatures.
- Log overrides and comfort complaints instead of treating them as inconvenient noise.
- Compare heating kWh across reasonably similar conditions. If the system also heats water, avoid assigning every change in gas use to space heating.
- Value the measured reduction using the applicable gas or electricity rate, then assign a status.
Suppose the comparable data shows 40 fewer gas kWh during the test period. At 7.97p per kWh, the measured difference is £3.19. That remains a period result, not an annual forecast. If the after-period was milder or the house was empty more often, mark it Investigating until another comparison supports it.
Recipe: standby-kill plugs after counting the plug itself
| Field | Setting |
|---|---|
| Difficulty | Easy to moderate |
| Useful data | Measured standby watts, scheduled off-hours and the smart plug’s own consumption |
| Hub or protocol note | Confirm the plug restores the intended state after an outage and does not interrupt updates or recordings |
| Initial status | Investigating until a net consumption reduction is measured |
Measure the target device in standby rather than relying on its specification sheet. Then measure the smart plug’s own draw with an upstream meter where possible; many plugs report only the downstream appliance load and omit their own electronics.
The annual calculation is:
annual net kWh = ((device standby watts × off-hours per day) − (plug watts × 24)) × 365 ÷ 1,000
annual electricity value = annual net kWh × applicable £/kWh
For illustration only, imagine measurements show an 8W standby load that can be disconnected for 20 hours daily and a plug consuming 1W continuously. The net calculation is 49.64 kWh a year, worth about £13.07 at 26.32p per kWh. If the target’s standby draw were close to the plug’s own consumption, the automation could save almost nothing.
Do not put network equipment, medical devices, security systems or appliances requiring continuous safe operation on a generic standby-kill schedule. Televisions, consoles and media equipment may need maintenance windows or wake-on-LAN behavior preserved. A plug that forces regular manual recovery belongs under Workaround, even when the meter shows a modest saving.
Recipe: move flexible loads to a real off-peak rate
| Field | Setting |
|---|---|
| Difficulty | Moderate |
| Useful data | Half-hourly import, appliance kWh and dated peak/off-peak tariff rates |
| Hub or protocol note | Use tariff-aware schedules and preserve appliance safety controls |
| Initial status | Confirmed only after off-peak billing data matches the intended schedule |
Ofgem notes that many suppliers offer off-peak smart-meter tariffs. This recipe applies only if the household has actually enrolled in one and knows its charging windows. The standard cap rate alone does not create an off-peak discount.[2]
Candidates include an electric vehicle, dishwasher, washing machine, tumble dryer, immersion heater or battery charger, subject to manufacturer instructions and household fire-safety practices. Use native delayed-start controls where they are safer or more dependable than abruptly cutting mains power with a plug.
This automation normally reduces cost rather than energy. If a cycle uses 2 kWh before and after the move, consumption has not fallen. Its measured value is 2 multiplied by the difference between the tariff’s peak and off-peak rates. Do not value the same shift again at 26.32p per kWh as though those units had disappeared.
- Save the tariff name, effective dates, charging windows and peak/off-peak unit rates.
- Measure the load’s usual kWh and confirm that moving it will not create unacceptable noise, inconvenience or safety risk.
- Schedule the load within the tariff window, allowing for clocks, daylight-saving changes and jobs that run longer than expected.
- Check supplier half-hourly data or the bill to confirm the kWh were charged off-peak.
- Calculate the tariff-cost difference and keep total kWh visible beside it.
Keep the household ledger
Under the October 2026 cap rates, an avoided electricity kWh is worth more than an avoided gas kWh, but that does not automatically make an electricity automation the better project. The relevant comparison is the controllable kWh, the cost of the equipment, the plug or hub’s own consumption, the dependability of the automation and its effect on comfort.
Finish each recipe with a verification record containing the baseline dates, after-period dates, measured kWh change, rates used, platform and hub context, relevant comfort or occupancy notes, calculation and current status. Retain the raw screenshots or exports behind the result.
For the same automation pattern expressed against US utility pricing, see Smart Home Devices to Lower Your Electric Bill After a Rate Hike; its dollar calculations should not be substituted for the UK cap rates used here. The energy-dashboard verification example shows how import and production data can distinguish a real energy change from an apparent fault. If a firmware, integration or tariff update later breaks the recipe, record the change in Update Watch and demote its status rather than leaving an obsolete Confirmed label in place.
References
- Energy price cap will rise by 4% from October 2026 — Ofgem, 26 August 2026
- Energy price cap unit rates and standing charges — Ofgem
- What is the energy price cap? — MoneySavingExpert
- Home energy management — Home Assistant
- Heating controls — Energy Saving Trust, updated February 2026
- Smart Thermostats FAQs for EEPS — ENERGY STAR