The useful version of a smart home river-level monitor is not another sensor bolted to a fence post. It is your house listening to the same public river gauge you already check before moving a car, testing the sump pump, or texting the neighbor downstream.
NOAA's National Water Prediction Service publishes observed and forecast river stage data for more than 12,000 U.S. gauges, and those gauges can be pulled into Home Assistant without buying outdoor hardware.[1] The catch is important: forecast-based alerts only work when your chosen gauge actually publishes forecast data. Some gauges report current observations only, which is still useful for dashboards and rate-of-rise warnings, but not for “crest will exceed flood stage” automations.
Start With The Gauge, Not The Automation
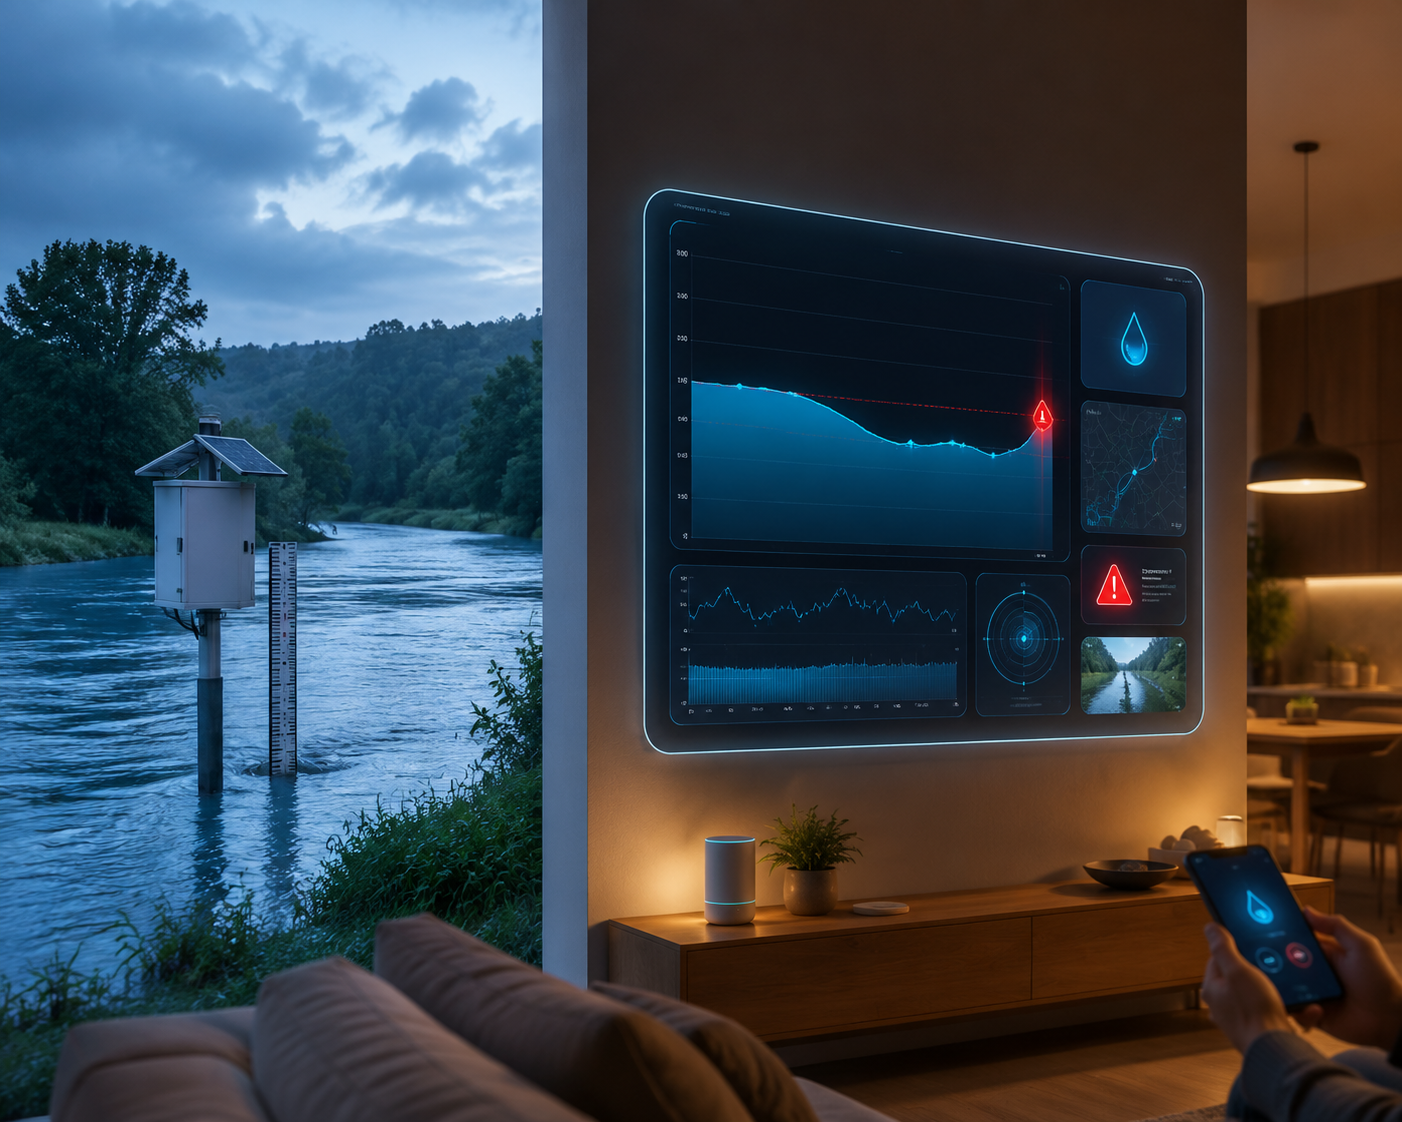
Before writing a single automation, pick the gauge your house should trust. Go to NOAA's NWPS map, search your address or nearby waterway, and open the closest relevant gauge page. Do not assume the nearest dot is the best one; a gauge upstream, downstream, or on the wrong tributary can describe a different problem than the one that reaches your street.
- Copy the exact gauge ID shown by NOAA. The public examples often look like short uppercase IDs, such as BRUN2 for Brunswick, Maine, but the practical rule is simple: use the exact ID from the gauge page.[1]
- Check whether the gauge page shows forecast data, not only observed stage. If there is no forecast line, table, or crest forecast for that location, forecast crest automations should not be used.
- Write down the action stage and flood stage shown for that gauge, if NOAA provides them. Those thresholds are what turn a dashboard number into a household decision.
- Open the XML endpoint in a browser by replacing GAUGEID in this URL: https://water.weather.gov/ahps2/hydrograph_to_xml.php?gage=GAUGEID. If the browser returns readable XML, Home Assistant can read it too.[2]
Rivercast can be a useful companion while hunting for nearby gauges because it presents real-time stage information in a mobile-friendly way, but it should not replace the NWPS check. The Home Assistant configuration below needs the NOAA gauge ID and, for forecast alerts, confirmation that forecast data exists for that location.[4]
Method A: REST Sensor From NOAA XML
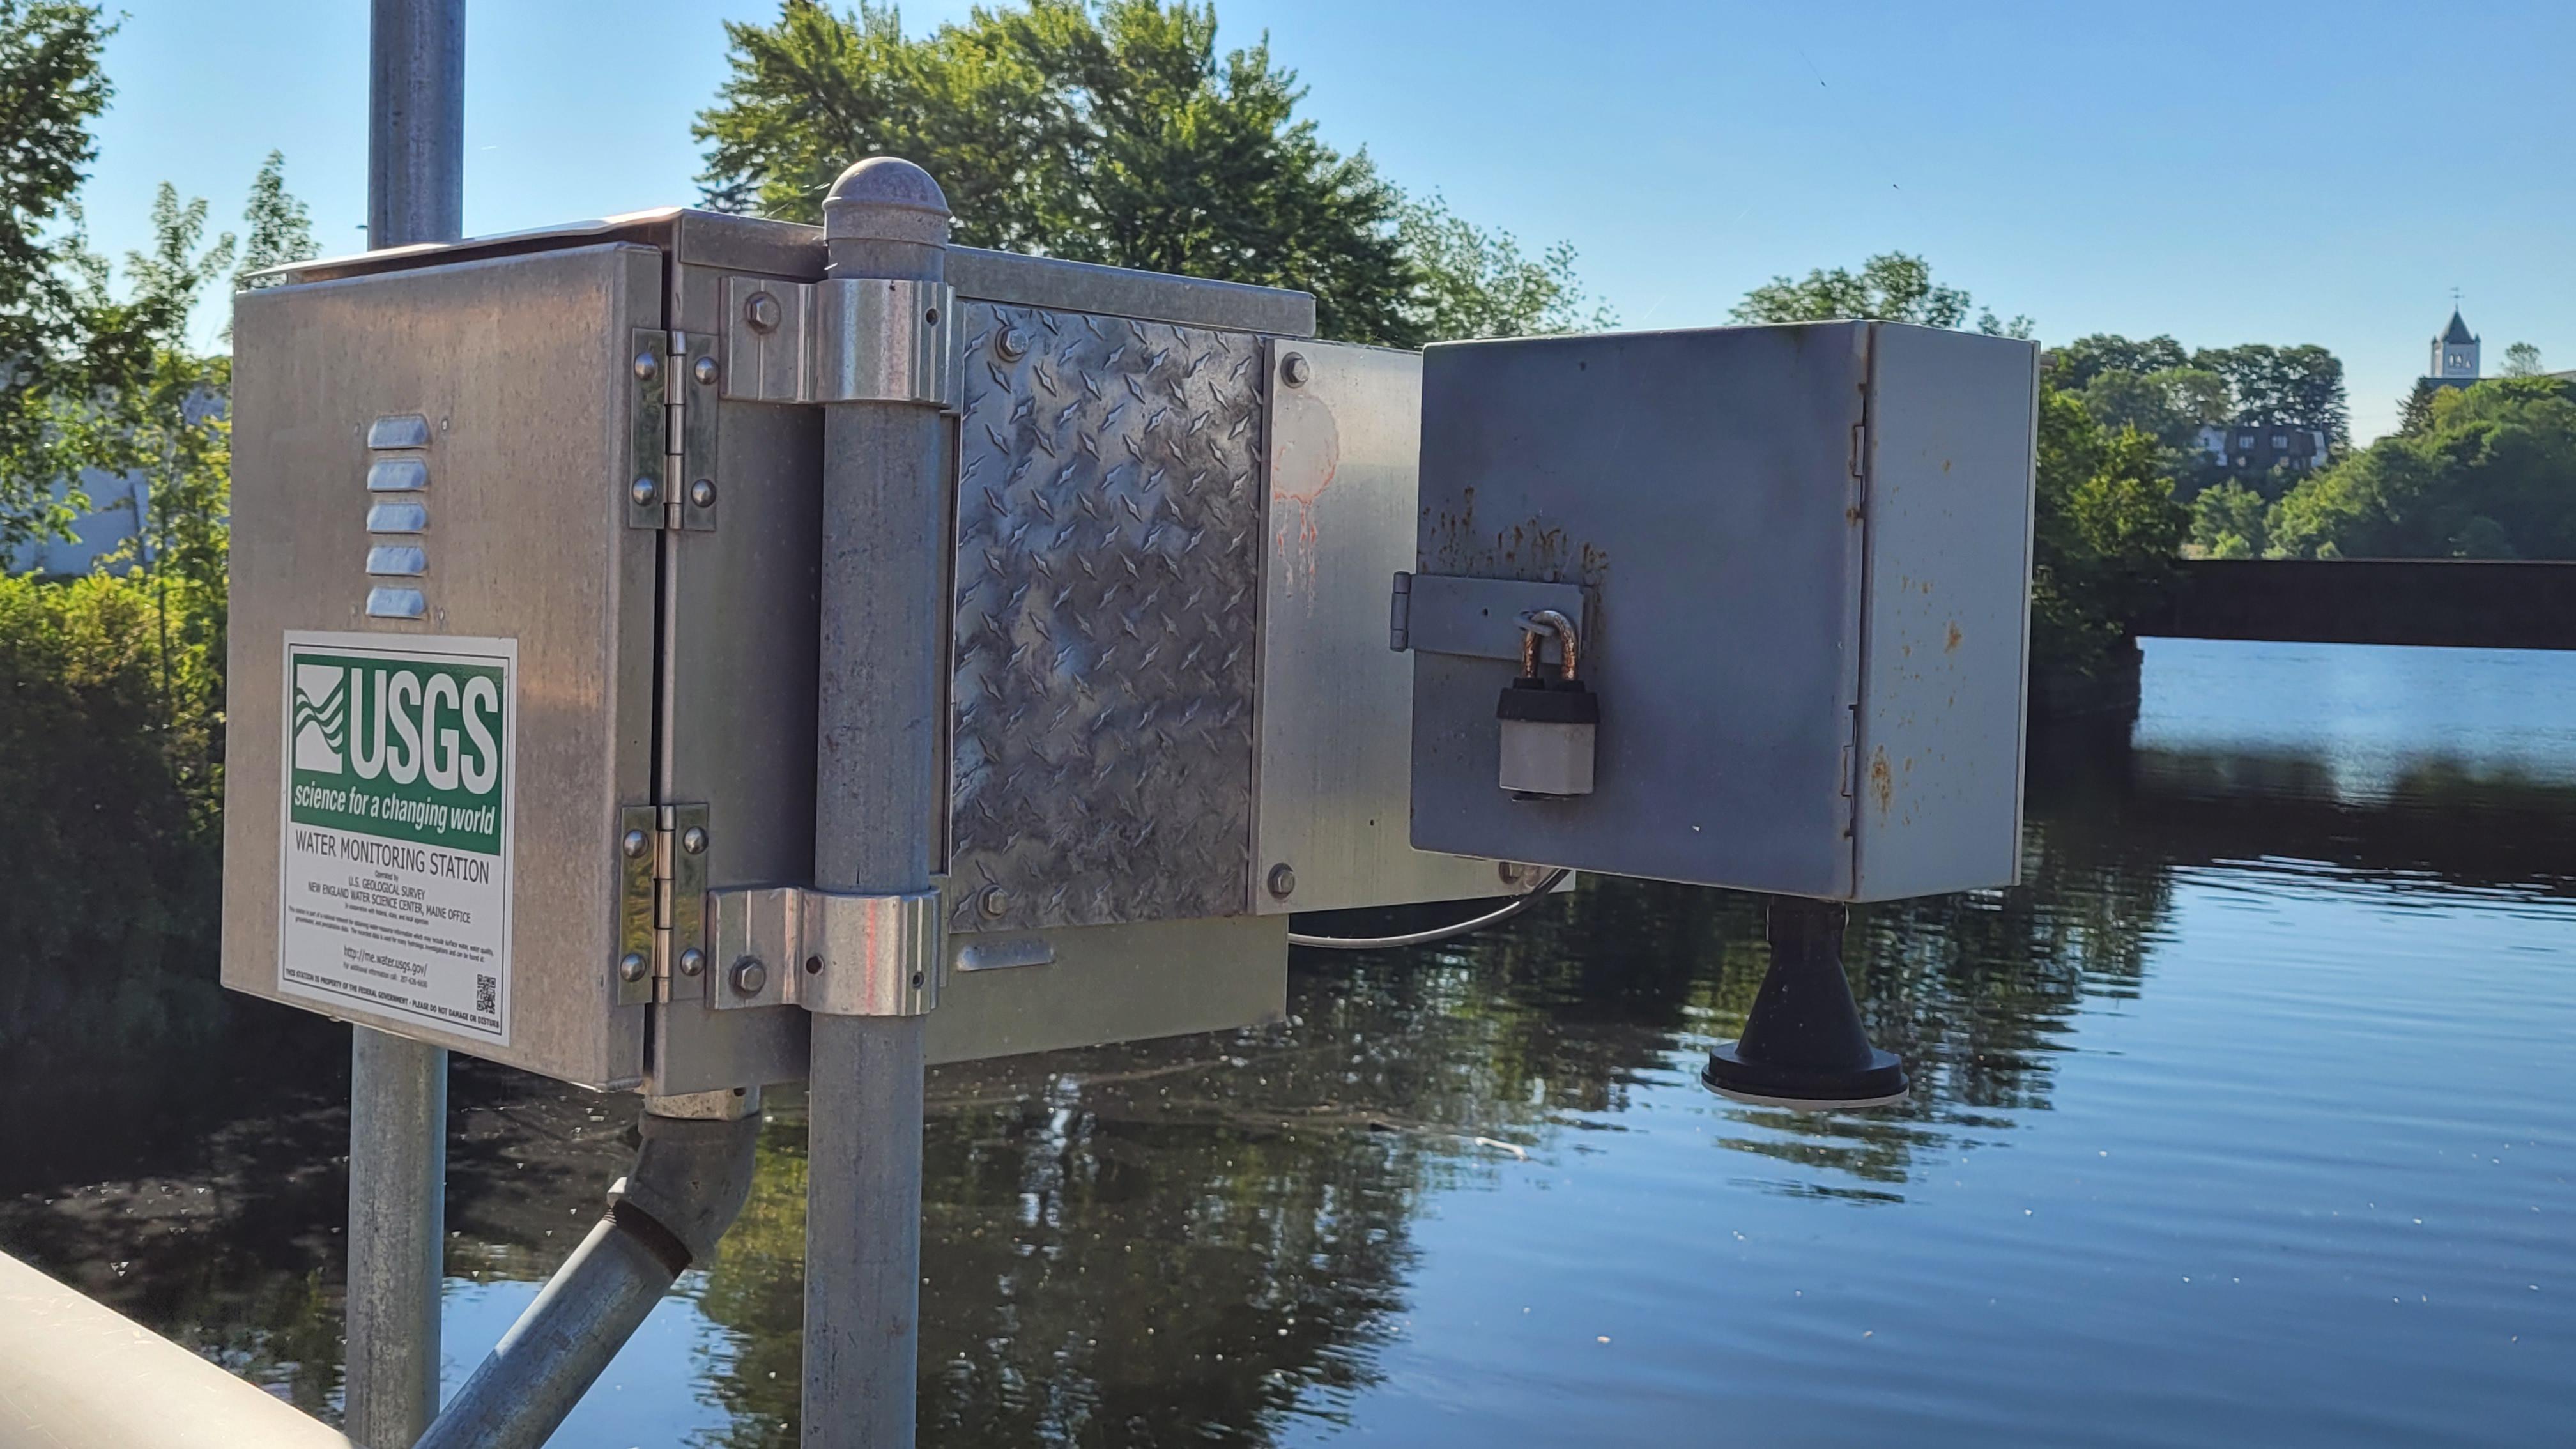
The REST route is the easiest to reason about: Home Assistant asks NOAA for the gauge's hydrograph XML, then template sensors pull out the values you care about. The Home Assistant community has documented this pattern using the NOAA XML endpoint at water.weather.gov.[2]
Use this method first if you want a direct “one gauge, one feed” setup. Replace GAUGEID with your NOAA gauge ID, then adjust the friendly names if you monitor more than one river.
sensor:
  - platform: rest
    name: noaa_river_raw_xml
    resource: "https://water.weather.gov/ahps2/hydrograph_to_xml.php?gage=GAUGEID"
    method: GET
    scan_interval: 900
    value_template: "{{ now().isoformat() }}"
    headers:
      User-Agent: "Home Assistant river monitor"

  - platform: template
    sensors:
      river_observed_stage_ft:
        friendly_name: "River Observed Stage"
        unit_of_measurement: "ft"
        value_template: >
          {% set xml = states('sensor.noaa_river_raw_xml') %}
          {% set values = xml | regex_findall('<primary>([0-9.]+)</primary>') %}
          {{ values[0] | float(0) if values | length > 0 else unknown }}

      river_forecast_crest_ft:
        friendly_name: "River Forecast Crest"
        unit_of_measurement: "ft"
        value_template: >
          {% set xml = states('sensor.noaa_river_raw_xml') %}
          {% set values = xml | regex_findall('<primary>([0-9.]+)</primary>') | map('float') | list %}
          {{ values | max if values | length > 0 else unknown }}

      river_data_last_checked:
        friendly_name: "River Data Last Checked"
        value_template: "{{ states('sensor.noaa_river_raw_xml') }}"
After restarting Home Assistant or reloading YAML, check Developer Tools before building automations. You want `sensor.noaa_river_raw_xml` to update on schedule, `sensor.river_observed_stage_ft` to show a number, and `sensor.river_forecast_crest_ft` to show a number only when forecast values are present.
- If the raw XML sensor updates but the stage sensors show `unknown`, open the NOAA XML URL in a browser and confirm the XML contains `<primary>` values.
- If observed stage works but forecast crest does not, your gauge may not publish forecast data. Use observed-stage and rate-of-rise automations instead.
- If all sensors are unavailable, check the gauge ID first. One wrong character is enough to turn a working configuration into a silent one.
One caution about the XML shortcut: the template above treats the largest parsed primary value as the forecast crest. That is usually the number you want for threshold automations, but it is still worth comparing the entity against the NOAA gauge page during setup. The goal is not a beautiful entity list; it is an alert that means what you think it means.
Method B: Command-Line Sensor With curl And jq
The command-line route is better when you want structured fields instead of template parsing inside Home Assistant. The community pattern uses `curl` and `jq` against NOAA data, producing named fields such as stage, flow, timestamp, and trend arrow.[2] It is more controllable than the REST XML method, but it also adds shell quoting, package availability, and CSV parsing to the failure list.
Use this method if your Home Assistant host already has `curl` and `jq`, or if you are comfortable installing them. Replace `NOAA_CSV_URL_FOR_YOUR_GAUGE` with the CSV data link for your gauge from NWPS, and keep the JSON keys stable so your template sensors do not break later.
command_line:
  - sensor:
      name: noaa_river_json
      command: >
        curl -s "NOAA_CSV_URL_FOR_YOUR_GAUGE" |
        jq -R -s '
          split("\n") |
          map(select(length > 0)) |
          . as $rows |
          {
            stage_ft: ($rows[-1] | split(",")[1] | tonumber),
            flow_cfs: ($rows[-1] | split(",")[2] | tonumber?),
            timestamp: ($rows[-1] | split(",")[0]),
            previous_stage_ft: ($rows[-2] | split(",")[1] | tonumber),
            trend_arrow: (if (($rows[-1] | split(",")[1] | tonumber) > ($rows[-2] | split(",")[1] | tonumber)) then "↑" elif (($rows[-1] | split(",")[1] | tonumber) < ($rows[-2] | split(",")[1] | tonumber)) then "↓" else "→" end)
          }'
      scan_interval: 900
      value_template: "{{ value_json.stage_ft }}"
      unit_of_measurement: "ft"
      json_attributes:
        - stage_ft
        - flow_cfs
        - timestamp
        - previous_stage_ft
        - trend_arrow
Then expose the attributes as regular template sensors so automations and dashboard cards can use them cleanly.
template:
  - sensor:
      - name: "River Stage"
        unit_of_measurement: "ft"
        state: "{{ state_attr('sensor.noaa_river_json', 'stage_ft') }}"

      - name: "River Flow"
        unit_of_measurement: "cfs"
        state: "{{ state_attr('sensor.noaa_river_json', 'flow_cfs') }}"

      - name: "River Observation Time"
        state: "{{ state_attr('sensor.noaa_river_json', 'timestamp') }}"

      - name: "River Trend"
        state: "{{ state_attr('sensor.noaa_river_json', 'trend_arrow') }}"

      - name: "River Two Reading Change"
        unit_of_measurement: "ft"
        state: >
          {% set current = state_attr('sensor.noaa_river_json', 'stage_ft') | float(0) %}
          {% set previous = state_attr('sensor.noaa_river_json', 'previous_stage_ft') | float(0) %}
          {{ (current - previous) | round(2) }}
The verification step is different here. First run the command on the Home Assistant host itself, not from your laptop, because Home Assistant is the machine that needs `curl`, `jq`, and network access. Then confirm `sensor.noaa_river_json` has attributes, not just a state value. If the command works in a terminal but fails in Home Assistant, quote handling is the first place to look.
| Use case | Better fit |
|---|---|
| You want the shortest path from NOAA gauge ID to Home Assistant entities | REST XML sensor |
| You want named fields such as stage, flow, timestamp, and trend | Command-line sensor |
| You dislike maintaining shell commands inside YAML | REST XML sensor |
| You are comfortable testing commands directly on the Home Assistant host | Command-line sensor |
Turn River Data Into Household Alerts
Once the entity updates reliably, the house can start making noise. Use NOAA's action stage and flood stage for your selected gauge when those thresholds are available, and set them as helpers so they are visible and editable from the UI.
input_number:
  river_action_stage_ft:
    name: River Action Stage
    min: 0
    max: 100
    step: 0.1
    unit_of_measurement: "ft"

  river_flood_stage_ft:
    name: River Flood Stage
    min: 0
    max: 100
    step: 0.1
    unit_of_measurement: "ft"

  river_rate_warning_ft:
    name: River Rate Warning
    min: 0
    max: 10
    step: 0.1
    unit_of_measurement: "ft"
The action-stage alert should be noticeable but not theatrical. A mobile notification and yellow light are enough for “pay attention soon.” Replace the entity names with your phone and light.
automation:
  - alias: "River forecast exceeds action stage"
    mode: single
    trigger:
      - platform: template
        value_template: >
          {{ states('sensor.river_forecast_crest_ft') | float(0) >= states('input_number.river_action_stage_ft') | float(0) }}
    condition:
      - condition: template
        value_template: "{{ states('sensor.river_forecast_crest_ft') not in ['unknown', 'unavailable'] }}"
    action:
      - service: notify.mobile_app_YOUR_PHONE
        data:
          title: "River action stage forecast"
          message: >
            Forecast crest is {{ states('sensor.river_forecast_crest_ft') }} ft.
            Action stage is {{ states('input_number.river_action_stage_ft') }} ft.
      - service: light.turn_on
        target:
          entity_id: light.YOUR_ALERT_LIGHT
        data:
          color_name: yellow
          brightness_pct: 80
      - delay: "00:00:10"
      - service: light.turn_off
        target:
          entity_id: light.YOUR_ALERT_LIGHT
Flood stage is different. If this alert wakes people or activates a siren, the trigger should be plain, auditable, and tied to the forecast crest only after you have confirmed that your gauge publishes forecast data.
automation:
  - alias: "River forecast exceeds flood stage"
    mode: single
    trigger:
      - platform: template
        value_template: >
          {{ states('sensor.river_forecast_crest_ft') | float(0) >= states('input_number.river_flood_stage_ft') | float(0) }}
    condition:
      - condition: template
        value_template: "{{ states('sensor.river_forecast_crest_ft') not in ['unknown', 'unavailable'] }}"
    action:
      - service: notify.mobile_app_YOUR_PHONE
        data:
          title: "Flood stage forecast"
          message: >
            Forecast crest is {{ states('sensor.river_forecast_crest_ft') }} ft.
            Flood stage is {{ states('input_number.river_flood_stage_ft') }} ft.
      - service: light.turn_on
        target:
          entity_id: light.YOUR_RGB_LIGHT
        data:
          color_name: red
          brightness_pct: 100
      - service: siren.turn_on
        target:
          entity_id: siren.YOUR_SIREN
If your gauge does not include forecast data, a rate-of-rise warning can still buy time. The example below fires when the river rises by the threshold stored in `input_number.river_rate_warning_ft` between the two readings exposed by the command-line method. The research example for this pattern is a rise such as 1 ft in 2 hours; set the number and time window according to the behavior of your own gauge and how often your sensor updates.[2]
automation:
  - alias: "River rising quickly"
    mode: single
    trigger:
      - platform: template
        value_template: >
          {{ states('sensor.river_two_reading_change') | float(0) >= states('input_number.river_rate_warning_ft') | float(0) }}
    condition:
      - condition: template
        value_template: "{{ states('sensor.river_two_reading_change') not in ['unknown', 'unavailable'] }}"
    action:
      - service: notify.mobile_app_YOUR_PHONE
        data:
          title: "River rising quickly"
          message: >
            River stage rose {{ states('sensor.river_two_reading_change') }} ft between recent readings.
            Current stage is {{ states('sensor.river_stage') }} ft.
      - service: light.turn_on
        target:
          entity_id: light.YOUR_ALERT_LIGHT
        data:
          color_name: orange
          brightness_pct: 90
Test The Alert Path Before Weather Arrives
Do not wait for a storm to find out that the phone target was renamed or the siren entity is disabled. Temporarily lower `input_number.river_action_stage_ft` below the current stage, run the automation, and watch the entire path: Home Assistant evaluates the trigger, the phone receives the message, the light changes, and the household can tell what the alert means.
- Confirm the gauge entity updated recently, not yesterday.
- Confirm the observed stage in Home Assistant roughly matches the NOAA gauge page.
- Confirm forecast crest is not `unknown` before enabling forecast automations.
- Confirm the action-stage alert is softer than the flood-stage alert.
- Restore the real threshold values after testing.
Add A Hydrograph With RiverWise
A number is enough for an automation, but a hydrograph is better for human judgment. RiverWise is an open-source Lovelace card that renders live river hydrographs with observed and forecast lines, flood stage indicators, and configurable thresholds; the documented version in the research material is v0.2.7.[3]
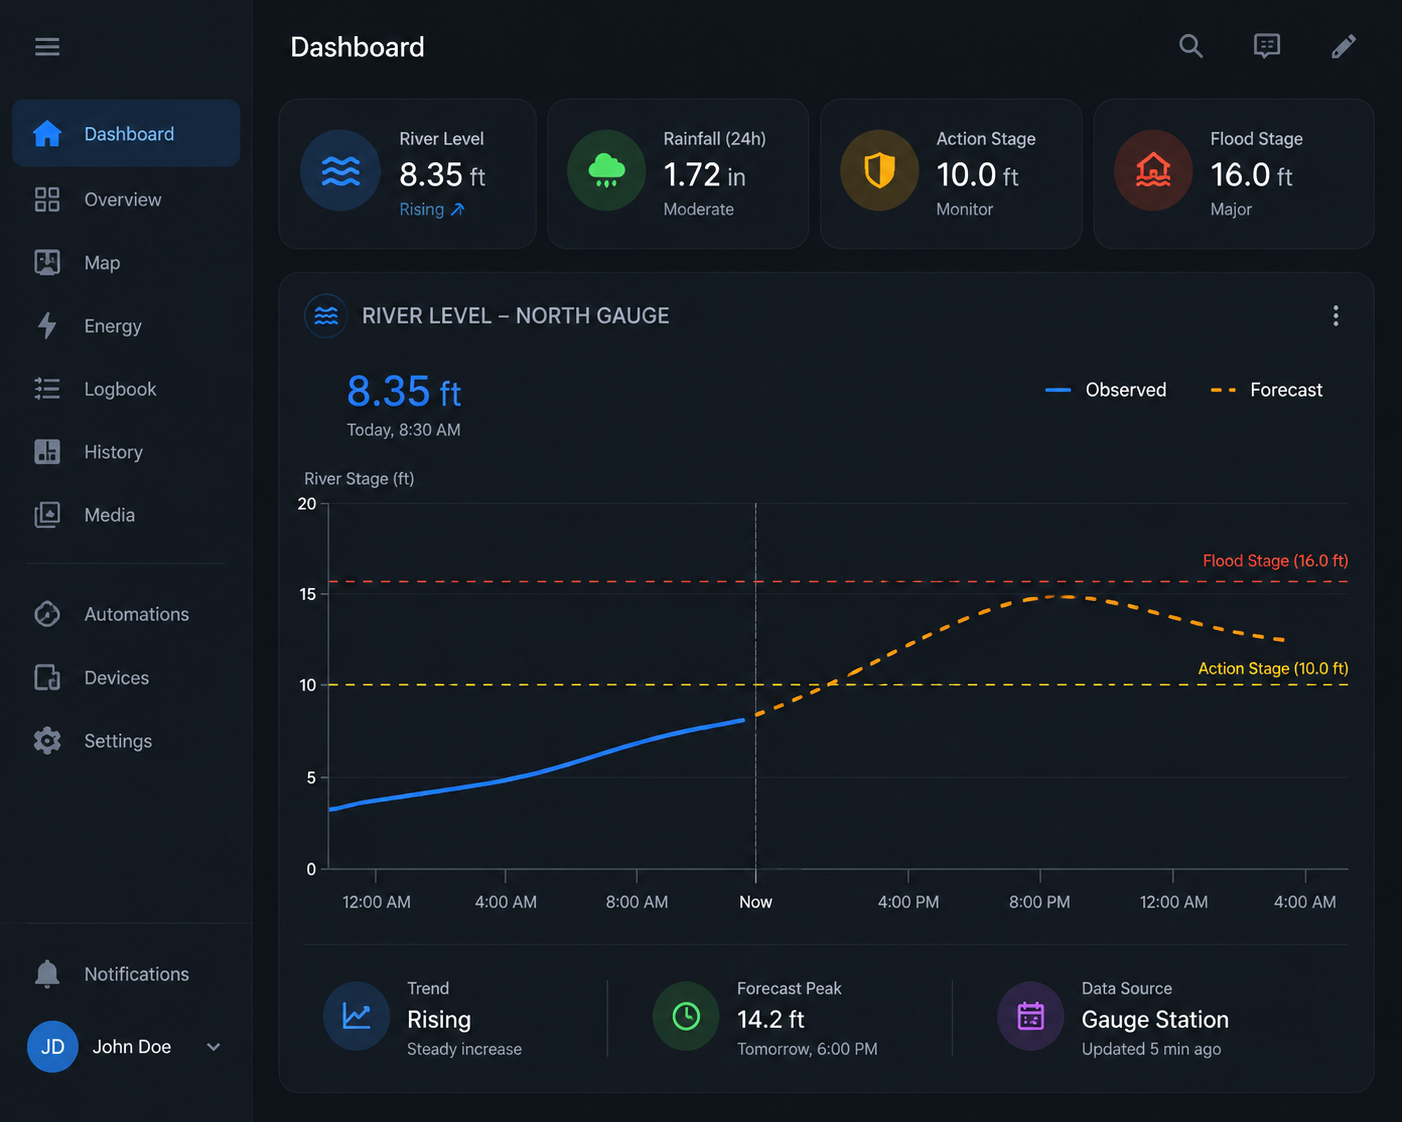
Install RiverWise as a custom Lovelace card, then point it at the same sensor data you already verified. The card should not be the first thing you configure. It is there to make river behavior legible after the underlying feed and alerts are working.
type: custom:river-wise-card
title: Nearby River
gauge_id: GAUGEID
observed_sensor: sensor.river_observed_stage_ft
forecast_sensor: sensor.river_forecast_crest_ft
action_stage: input_number.river_action_stage_ft
flood_stage: input_number.river_flood_stage_ft
show_forecast: true
If your gauge has no forecast data, set the card up around observed stage and thresholds instead of pretending the missing line is a dashboard problem. A blank forecast is usually a data availability issue, not a Lovelace issue.
A Short Note For UK Gauges
UK readers should not copy the NOAA setup. Home Assistant has a native Environment Agency Flood Gauges integration for Environment Agency river and flood gauge data, which is the cleaner starting point for that data source.[5]
What A Finished Setup Should Have
A working setup is not measured by how many cards are on the dashboard. It has one verified NOAA gauge ID, one integration method that updates reliably, visible observed river stage, forecast crest only when the gauge supports it, and at least one tested alert that reaches the people who need to act.
References
- National Water Prediction Service, NOAA National Water Prediction Service, https://water.noaa.gov
- Create graph/automation based on river level, Home Assistant Community, https://community.home-assistant.io/t/498831
- river-wise, GitHub, https://github.com/TheWillMiller/river-wise
- Rivercast, Rivercast, https://rivercastapp.com
- Environment Agency Flood Gauges, Home Assistant, https://www.home-assistant.io/integrations/eafm/
Community Tips
Share platform-specific variations, steps that have changed after app updates, or tips that helped your installation succeed.
Comments
Join the discussion with an anonymous comment.