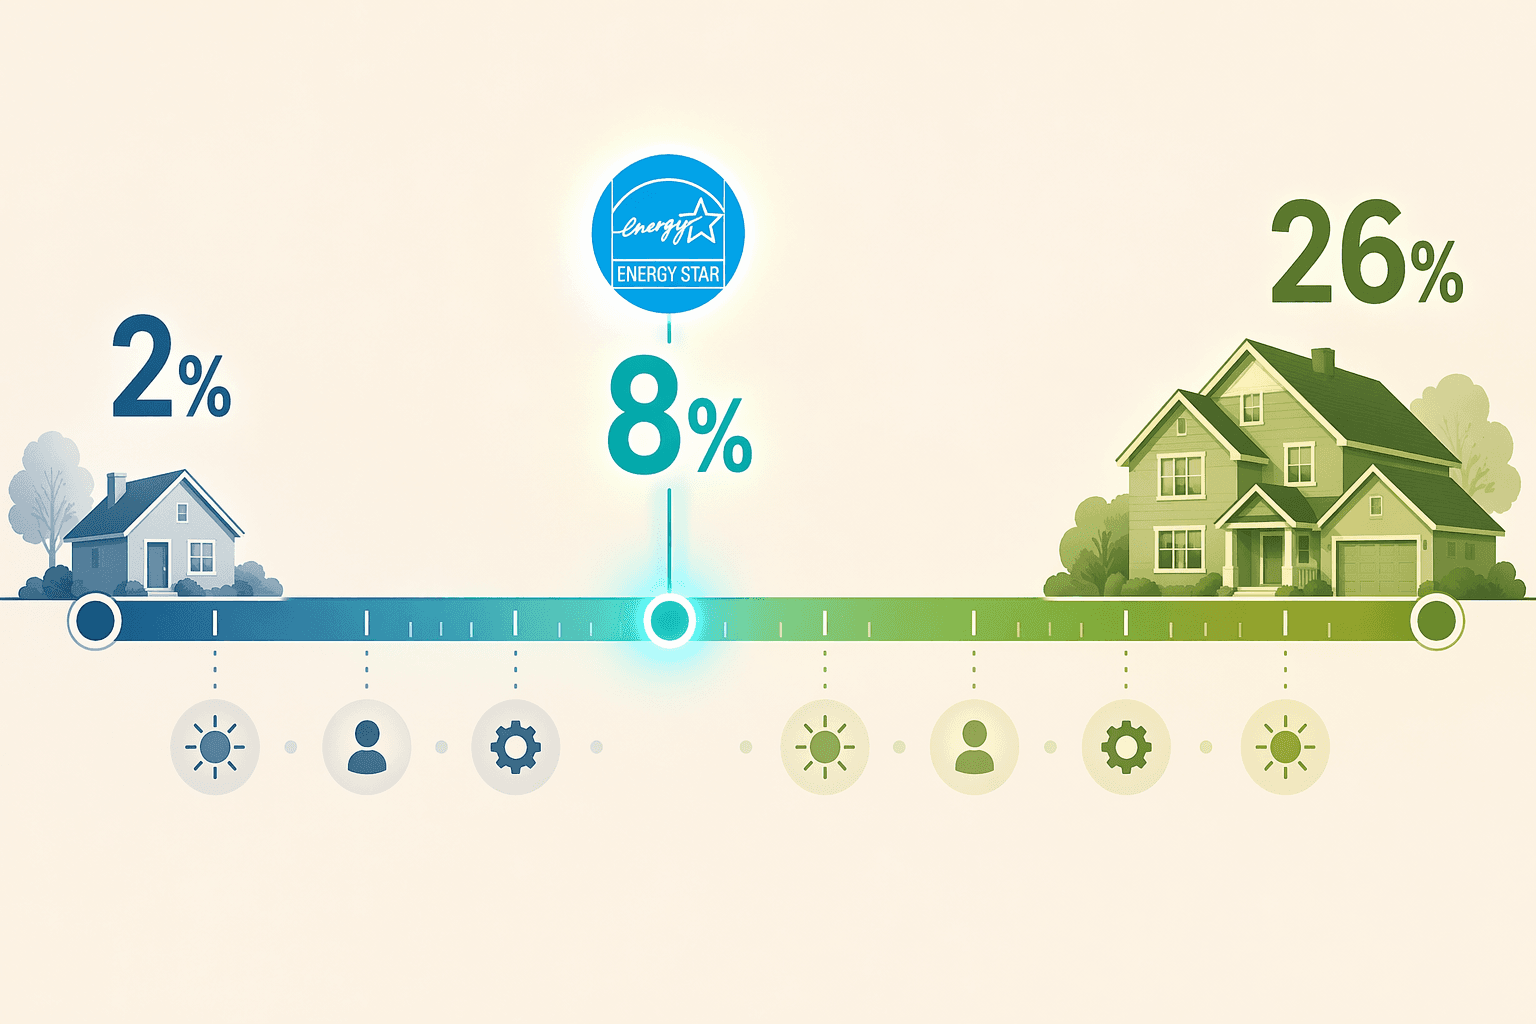
If you look up smart thermostat savings, you will find three numbers: 8% from ENERGY STAR, 12–15% from Nest, and up to 26% from Ecobee. All three are real. They are just not describing the same home.
The honest range runs from about 2% in a temperate, always-occupied home to more than 26% in an extreme climate with an empty daytime schedule and a single-speed HVAC system. The average tells you where the middle of the distribution sits. It does not tell you where you land.

What the 8% Actually Measures
Let me be clear: the 8% figure from ENERGY STAR is not fake. It comes from real homes, real data, and a rigorous methodology. It is a weighted national average, which blends households from every climate zone, occupancy pattern, and HVAC type. The blend smooths out the extremes — the homes that save 2% and the ones that save 26% — and reports the center. That is useful for policymakers and program managers. It is not a promise for your house.
I have worked with utility efficiency programs for years, and the first thing I learned is that averages erase the circumstances that determine real savings. A homeowner in Phoenix with a 3,000-square-foot house that runs the AC nine months a year and sits empty eight hours a day will see a different outcome than a retiree in San Diego whose house is occupied all day and whose heating and cooling bills total $60 a month. The average does not help either of them decide whether a $250 thermostat makes sense.
ENERGY STAR does not run lab tests or accept manufacturer claims. It requires that a candidate thermostat achieve a weighted national average heating runtime reduction of at least 8% and a cooling runtime reduction of at least 10%, measured by analyzing a full year of data from randomly selected homes across all U.S. climate zones using EPA-provided software. That methodology is the gold standard in this space — independent, standardized, and designed to avoid regional over-representation. I trust it more than any other figure because I can see what it measured: runtime reduction across a diverse sample, not self-reported user savings or model-based forecasts. But I also know what it does not tell me: how my own home compares to the sample.
The 8% is a weighted average across all home types. If your home is occupied most of the day and you live in a mild climate, your savings will likely fall below the average. If you are in Minnesota with a drafty house and a regular work schedule, your savings may be significantly higher.
What Nest and Ecobee’s Numbers Actually Show
You have likely seen Nest’s internal research showing 12–15% savings and Ecobee’s claim of up to 26%. These are real numbers, but they carry important caveats that often get dropped in marketing. Nest’s study analyzed customer data from homes that had already purchased and installed its thermostat. That creates self-selection bias — people who buy a smart thermostat are more likely to change their habits and to live in homes where savings are easier to achieve. Ecobee’s “up to 26%” is explicitly a ceiling, not a typical outcome. In the same breath, CNET notes that figure is “potentially around $250 per year” — an upper bound, not an average.
I do not dismiss these numbers. They show what is possible under favorable conditions. But I would not use them as a baseline for your own estimate. The ENERGY STAR figure, despite being a national average, is a more conservative starting point because it comes from an independent, standardized test. If you want to know what an optimist might achieve, look at the manufacturer studies. If you want a realistic floor, use ENERGY STAR.
The Real Drivers: Climate, Occupancy, and Your HVAC System
Three variables explain most of the variation between homes: where you live, who is home when, and what equipment heats and cools your space.
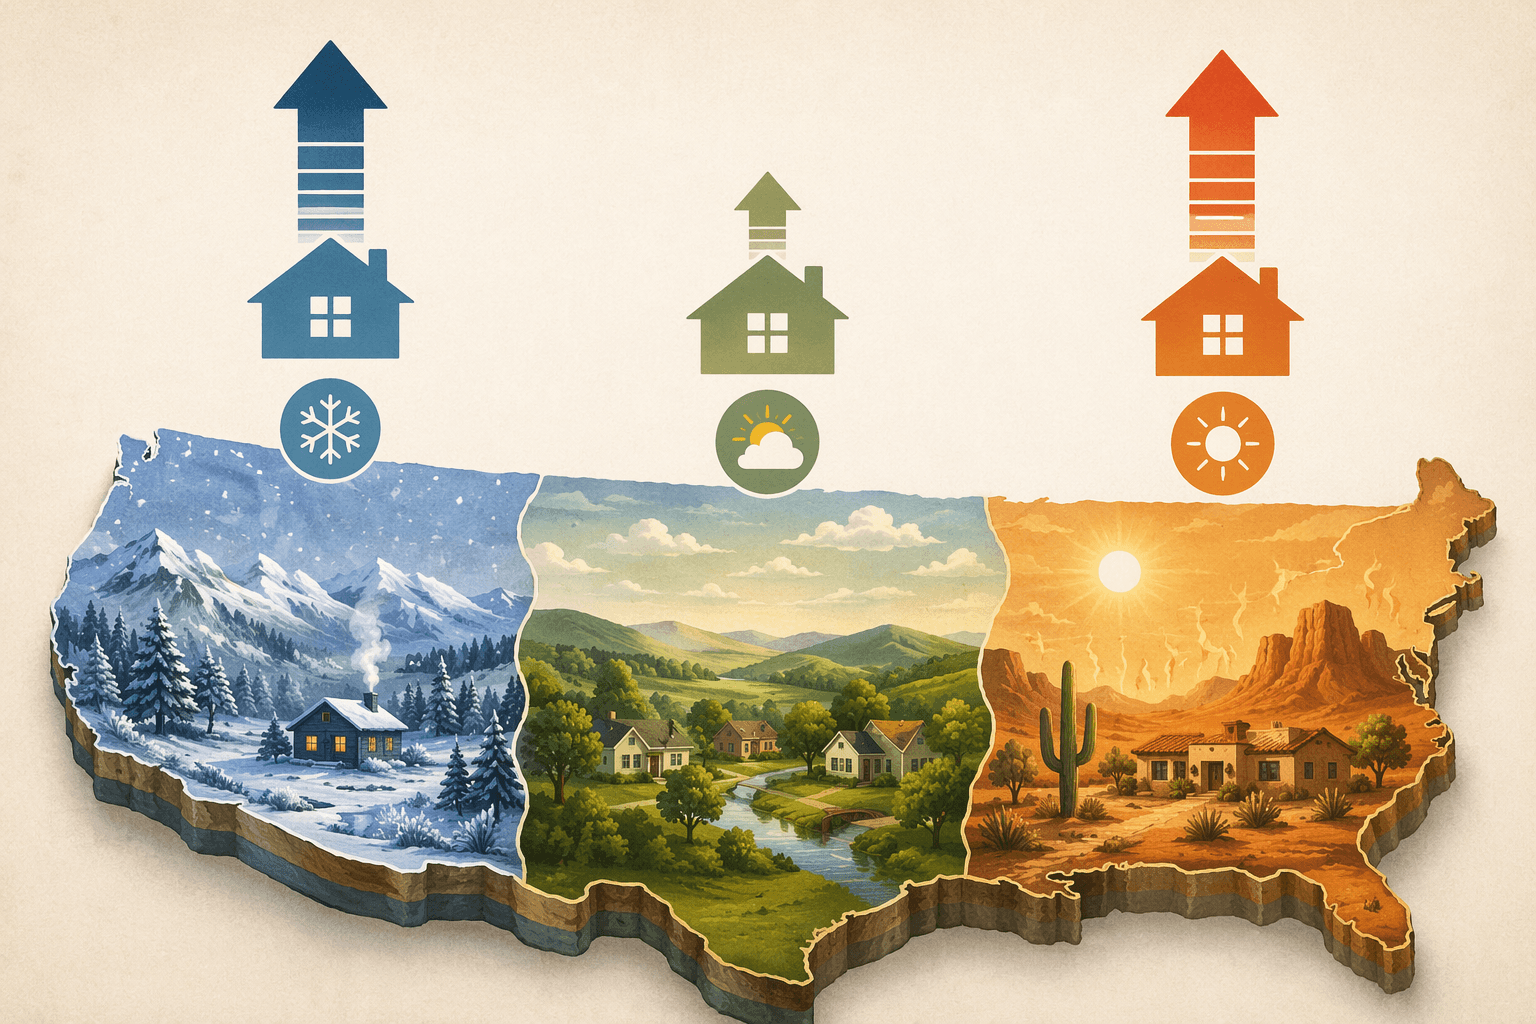
Climate
ENERGY STAR is direct: “Homes that experience extreme temperature changes over the year generally see greater savings; temperate climates and always-occupied homes see less savings.” A home in Phoenix or Minneapolis has more runtime to reduce than one in San Francisco or Seattle. The absolute savings potential scales with the size of your heating and cooling bills. If your monthly HVAC cost is $200, 8% is $192 a year. If it is $80, 8% is $77.
Occupancy
A smart thermostat saves energy by turning down the system when no one is home or everyone is asleep. If your house is occupied most of the day — retirees, remote workers, stay-at-home parents — there are fewer hours when a setback can run. Consumer Reports found that “homes that are occupied most of the time see smaller savings” for exactly this reason.
But the same survey also found that 29% of programmable thermostat owners never program their device. That is, in my view, the strongest argument for a smart thermostat: it automates something that nearly a third of people do not bother to do. The DOE says that manually setting a 7–10°F setback for 8 hours a day saves up to 10%. A smart thermostat captures that same savings without requiring you to remember to set it. The value is not in finding a better algorithm — it is in making the algorithm stick.
HVAC Type
Single-speed furnaces and air conditioners benefit most from setbacks. When you raise or lower the setpoint, they stay off longer, and the savings are proportional to the off time. Variable-speed heat pumps are different. Consumer Reports notes that “modern variable-speed air conditioners and heat pumps are designed to run more efficiently at a fixed temperature, so aggressive setbacks may reduce or cancel out savings.” The DOE historically recommended against programmable thermostats for heat pumps for the same reason — the recovery period can force the system into inefficient auxiliary heat.
If you have a variable-speed heat pump, you cannot assume the 8% figure applies. You should look for a thermostat explicitly designed for your system — many manufacturers now offer models with “heat pump” or “variable-speed” settings that avoid aggressive recovery modes.
| Factor | Direction of Savings | Why |
|---|---|---|
| Climate | Extreme → higher | More runtime to reduce |
| Occupancy | Often empty → higher | More setback hours |
| HVAC type | Single-speed → higher | Linear savings per off-hour |
| HVAC type | Variable-speed heat pump → lower | Efficiency loss from recovery |
Demand Response: An Extra $100 or So
Some utilities pay customers for allowing minor adjustments during peak grid events. Ecobee’s Community Energy Savings program, for example, can earn participants up to $125 extra per year. Similar programs from Georgia Power, ComEd, and Southern California Edison offer rebates of $100 to $125. These are conditional — you have to enroll, and not every utility participates. But when they do, they add a meaningful layer above the direct energy savings. For a more complete picture of available incentives, see our ENERGY STAR rebate guide for 2026.
How to Estimate Your Own Savings
You can build a rough estimate by answering three questions:
- What is your annual heating and cooling cost? Look at your utility bills and separate out the HVAC portion. A reasonable rule of thumb is that heating and cooling account for about half of a typical home energy bill.
- How many hours a day is your home unoccupied or everyone asleep? More than eight? You are in the higher-savings group. Less than four? Expect lower savings.
- What type of HVAC system do you have? Single-speed furnace or AC? Use 8–10% as your starting range. Variable-speed heat pump? Start lower — maybe 3–5% — and confirm compatibility with your thermostat.
I cannot give you a single number because the honest answer is “it depends.” But now you know what it depends on. Use the ENERGY STAR 8% as a middle-of-the-road estimate for a typical home, adjust upward if you live in an extreme climate with regular empty hours, adjust downward if your house is always occupied or runs a variable-speed heat pump. If the result still looks worthwhile, the next step is to match a thermostat to your specific ecosystem and HVAC — check our best smart thermostat buyer guide for models suited to your situation.
The headline figure is not a lie. It just does not apply to you directly. That is not a flaw in the data — it is a reason to ask better questions before you buy.
Data Updates
Know about updated rebate programs, changed subscription prices, or new ENERGY STAR certifications? Submit a note below to help keep this content current. For formal data corrections, use the contact page.
Comments
Join the discussion with an anonymous comment.