
How to Compare Solar vs. Coal Power on Your Electric Bill
Solar's May 2026 win over coal happened on the wholesale grid, not at your meter. The homeowner's real question is whether rooftop solar's cost per kWh beats your retail electricity rate — this guide shows which two numbers to compare and why wholesale "solar beats coal" claims don't settle it.
Last updated
Solar’s May 2026 win over coal is real, but it is not the number a homeowner should use to buy panels. In that month, solar supplied 12.8% of U.S. electricity while coal supplied 12.2%, the first month on record when solar topped coal on the national grid; coal’s May share had fallen from 19.7% in 2021, while solar’s had risen from 5.4% over the same period [1].
That tells you the grid is changing. It does not tell you whether rooftop solar beats the electricity you are buying at your own meter. For that, the useful comparison is much narrower: your retail electricity rate versus the delivered cost per kilowatt-hour from a rooftop system on your home.
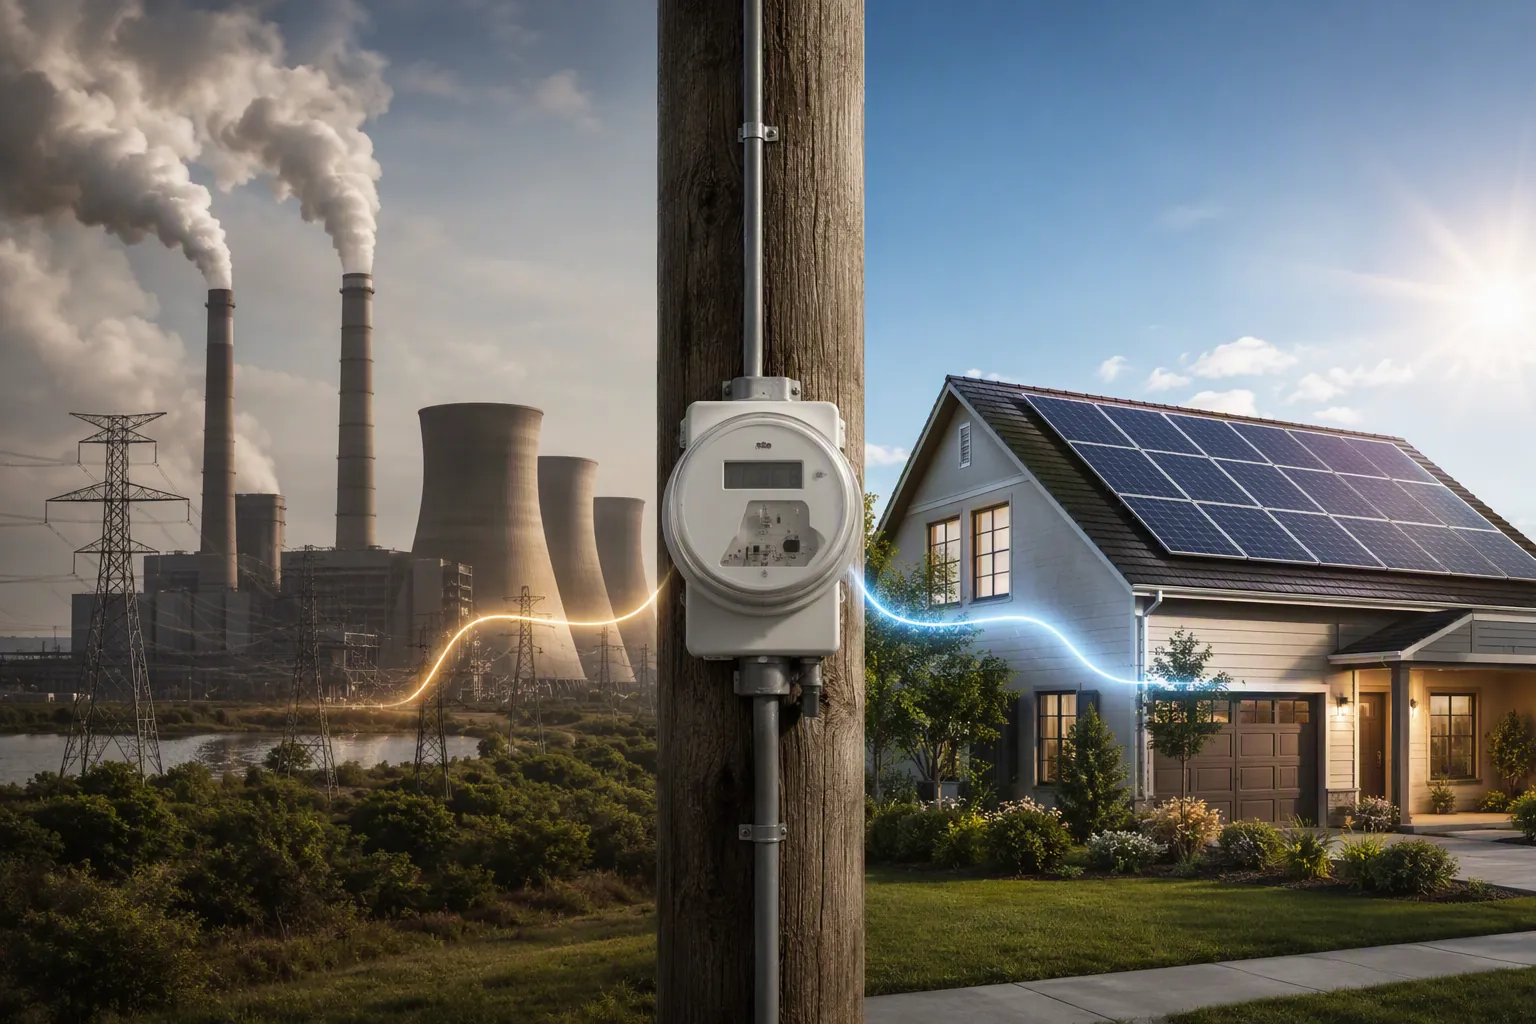
The two numbers that matter at the meter
A homeowner comparing solar vs. coal power should not start with a national generation chart or a utility-scale cost curve. Start with the bill.
| Number | What it means | Why it matters |
|---|---|---|
| Your retail electricity rate | The cents per kWh you pay for grid electricity that reaches your home, including the variable parts of generation and delivery charges | This is the price rooftop solar is trying to beat |
| Your rooftop solar delivered cost per kWh | Your total system cost, after confirmed incentives and financing costs, divided by the kWh the system is expected to deliver or credit over its useful life | This is the household-scale cost of replacing part of your grid purchases |
The first number comes from your utility bill. The second comes from your solar quote, financing terms, incentive eligibility, roof conditions, expected production, and net-metering or export-credit rules. If those two numbers are not in the same unit — cents per kWh delivered to your household — the comparison is already drifting.
A clean formula is:
Rooftop solar cost per kWh =
(net installed cost + financing costs + ownership costs) ÷ lifetime kWh used or credited
That formula is less exciting than “solar beats coal,” but it is the one that lands on a household budget. Coal may be losing economically on the wholesale grid while your local retail rate still remains low enough that rooftop solar has to work hard to compete. The opposite can also be true: a high retail rate can make rooftop solar pencil out even when your state still burns a meaningful amount of coal.
Why wholesale solar-versus-coal claims sound so decisive
There is a good reason search results often sound confident about solar being cheaper than coal. At the grid-planning level, the economics have moved sharply against coal.
Energy Innovation’s Coal Cost Crossover 3.0, published in January 2023, found that 99% of U.S. coal plants — 209 of 210 — cost more to keep running than replacing them with new local wind, solar, or storage resources [2]. That is a strong finding about the operating cost of existing coal plants versus new replacement resources. It is not a quote for a 12 kW system on a shaded roof with loan interest and local permitting costs.
The same distinction shows up in levelized cost of energy, or LCOE, tables. Lazard’s 2023 LCOE ranges, as compiled in public cost-of-electricity summaries, put utility-scale solar PV at $24–$96 per MWh, residential solar PV at $117–$282 per MWh, and coal at $68–$166 per MWh [3][4]. The important homeowner lesson is not simply that one line is lower than another. It is that utility-scale solar and residential rooftop solar are different cost categories.
Utility-scale solar benefits from large sites, bulk procurement, optimized siting, and professional grid operation. Residential solar has sales costs, rooftop labor, interconnection steps, smaller scale, financing choices, and household-specific production limits. A wholesale LCOE comparison can explain why utilities and grid planners are adding solar. It cannot, by itself, tell you whether your own array will beat your own bill.
The grid price rooftop solar has to beat
For most homeowners, the retail rate is the better starting point than coal’s generation cost. Retail electricity is not just fuel and power-plant operation. It includes wires, grid maintenance, utility programs, regulatory costs, billing, and charges that may or may not fall when you use fewer kWh.
In August 2026, ElectricChoice listed the U.S. average residential electricity rate at 18.44 cents per kWh, up 6.2% year over year and roughly 25% since 2022. Its state figures ranged from 12.35 cents per kWh in Idaho to 52.00 cents per kWh in Hawaii, with average household use at about 10,791 kWh per year and an average monthly bill near $171 [5].
That spread matters more than the national headline. A homeowner paying around the low end of those state rates has a harder target for rooftop solar to beat. A homeowner in a very high-rate state has a much larger avoided cost for every kWh the panels offset. The same solar quote can look attractive in one state and mediocre in another.
This is also where coal still deserves a precise treatment. Coal-fired generation can remain part of a low-rate state’s supply mix, and dispatchable plants still play a reliability role that intermittent rooftop production does not automatically replace. A solar panel on your roof can reduce purchases from the grid; it does not, by itself, make your home independent during an outage unless the system is designed with the right inverter and storage equipment. If outage behavior is part of the decision, that belongs in the same conversation as home power-outage planning, not in a simple solar-versus-coal price chart.
What rooftop solar is costing homeowners now
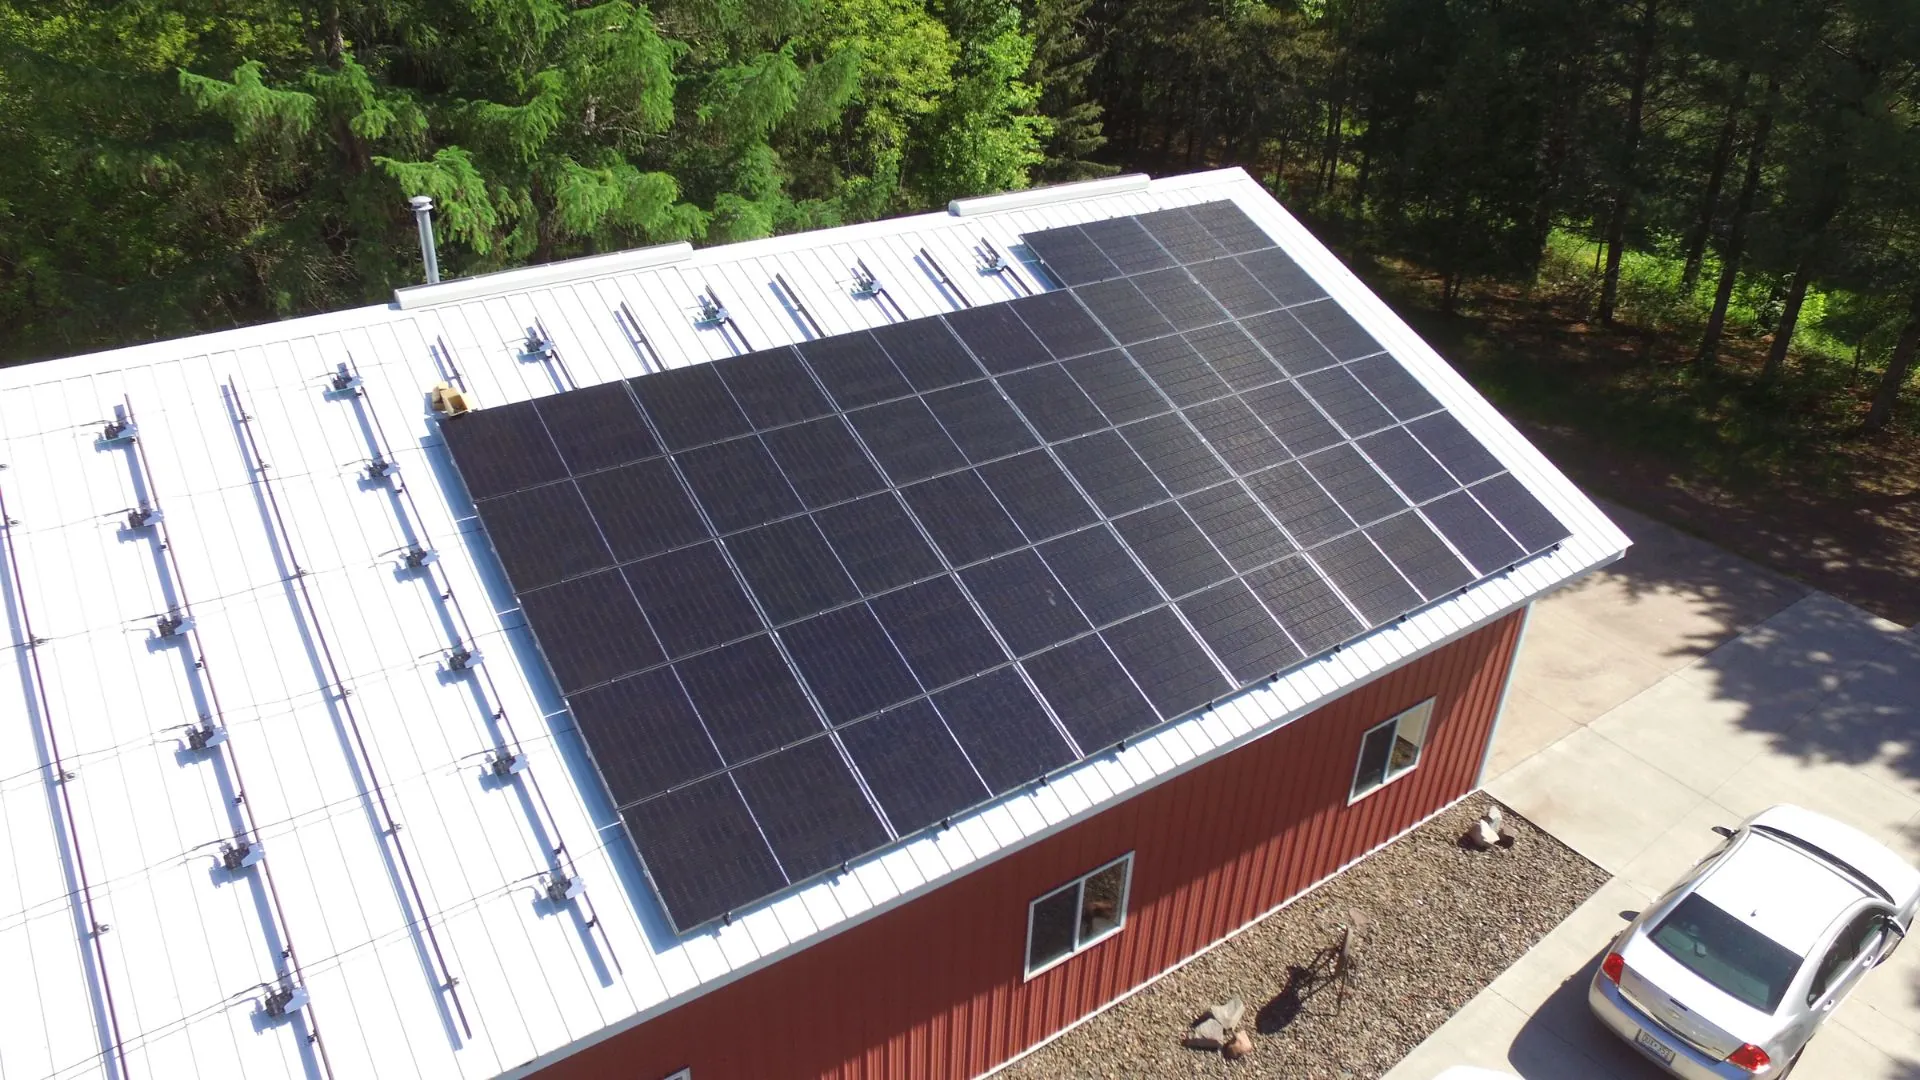
EnergySage’s H1 2026 marketplace data puts average residential solar pricing at about $2.59 per watt. A typical quoted 12 kW system cost about $31,135 before incentives, and EnergySage estimated average homeowner savings of about $60,500 over 25 years, with most shoppers falling in a $41,000–$155,000 savings range [6].
Those are useful marketplace numbers, not a substitute for your quote. They tell you the scale of the purchase and the reason the payback question is serious. A rooftop system is not a thermostat or a smart plug; it is a five-figure home-energy asset whose value depends on production, utility rules, financing, and how much expensive grid electricity it actually offsets.
The tax-credit line is especially easy to mishandle. EnergySage’s 2026 solar-savings page says the federal solar tax credit expired at the end of 2025 [6]. Energy.gov’s August 2024 homeowner article, by contrast, still described a 30% federal tax credit because it was written under the policy context at that time [7]. That conflict is not something to average out. For a 2026 purchase, incentives should be verified directly against current IRS, state, utility, and installer documentation before they are built into a payback calculation.
The delivered cost per kWh is where those details become visible. A cash purchase with a confirmed incentive has one cost curve. A loan with interest has another. A lease or power purchase agreement may remove some ownership responsibilities but replaces them with contract payments and escalation terms. A quote that looks cheaper on installed dollars can still be weaker if it produces less usable energy or earns poor export credits.
Payback changes by state, financing, and incentive status
Payback examples are helpful only if they are treated as examples, not promises. Energy.gov’s August 2024 article showed worked cases ranging from a California cash purchase with a credit paying back in under 5 years to a New York loan example using an 8-year loan term; it also noted that a sub-10-year payback could beat typical low-risk investment returns [7].
The examples are still useful for one reason: they show how sensitive the answer is to location and financing. California-style economics in a high-rate market with favorable incentives do not automatically transfer to a low-rate coal-heavy state. A loan that preserves cash can also raise the delivered cost per kWh if interest is high or the term is structured poorly. The household question is not whether solar can save money somewhere. It is whether the system in front of you beats the retail kWh you are actually avoiding.
This is also where smaller home-energy work can be useful, but only as a supporting calculation. If you are still deciding whether to reduce load first or buy panels first, the comparison in smart-home savings or solar first belongs upstream of the solar quote. Efficiency can reduce the system size you need; it does not make a weak solar kWh price magically competitive. For rate-shock households, cutting controllable load through lower electric bill steps after a rate hike can also change the size and timing of a solar purchase.
A practical meter-level test
Before accepting any “solar is cheaper than coal” claim as a household answer, run the comparison in the same unit your utility uses: cents per kWh.
- Find your current retail rate. Use recent bills, not a national average. Separate fixed monthly customer charges from variable kWh charges where possible, because fixed charges may remain even after solar is installed.
- Ask each installer for the expected first-year production and long-term production assumptions. The lifetime kWh estimate is the denominator in your rooftop solar cost per kWh.
- Use only confirmed incentives. If a proposal includes a federal, state, utility, or local incentive, require current eligibility documentation and timing.
- Add financing costs. A cash price and a loan price are not the same delivered kWh cost.
- Check export-credit rules. Full retail net metering, reduced export credits, time-of-use rates, and demand charges can produce very different savings from the same rooftop array.
- Compare the result with your retail rate today and with a cautious view of future rate increases. Do not assume every past increase will repeat at the same pace.
For a simple screen, a solar quote is stronger when its delivered cost per kWh is clearly below the variable retail rate you avoid. It is weaker when the quote only looks good after optimistic production assumptions, uncertain incentives, aggressive rate-increase forecasts, or ignored loan costs.
Battery storage should be tested separately. A battery may improve backup capability, shift solar into expensive evening hours, or help under time-of-use rates, but it also adds cost. If storage is part of the package, the relevant question becomes whether the combined solar-plus-battery system beats your bill and meets your reliability goals. Compatibility and control issues are their own layer, especially for homes considering solar battery integration.
So, is solar cheaper than coal power for a homeowner?
At the wholesale level, the evidence supports the broad direction: new solar has become highly competitive, coal’s economics have deteriorated, and the U.S. grid is visibly using more solar and less coal. That is the grid story.
At the household level, the answer depends on the two numbers at your meter. If your retail electricity rate is high enough, your roof produces well, your financing is reasonable, and your incentives and export credits are real, rooftop solar can beat the coal-heavy electricity you are buying now. If you live in a low-rate state, have a difficult roof, face weak export credits, or finance at expensive terms, the wholesale solar-versus-coal victory may not translate into household savings.
The mistake is not believing solar has become cheaper in many power-market comparisons. The mistake is using that comparison as if it were your bill. A homeowner does not buy utility-scale solar LCOE. A homeowner buys, finances, and lives with a rooftop system. Price that system in cents per kWh against the retail electricity you actually avoid, and the solar-versus-coal question becomes much clearer.
References
- Solar overtakes coal in US electricity for the first month on record — Ember
- The Coal Cost Crossover 3.0 — Energy Innovation, January 2023
- Cost of electricity by source — Wikipedia
- Levelized Cost of Energy+ — Lazard
- Electricity Rates by State — ElectricChoice
- How Much Do Solar Panels Save? — EnergySage
- Will I Save Money with Solar Energy? — U.S. Department of Energy, August 2024
Known issues with this device / protocol
Spec-version history
For active regressions on this protocol, see Update Watch.
No linked Update Watch entries yet.